PHOTOGRAMMETRIC ENGINEERING & REMOTE SENSING
December 2016
967
Generating a Hazard Map of Dynamic Objects
Using Lidar Mobile Mapping
Alexander Schlichting and Claus Brenner
Abstract
One of the hardest problems for future self-driving cars is to
predict hazardous situations involving pedestrians and cyclists.
Human drivers solve this problem typically by having a deeper
understanding of the scene. The technical equivalent of this is to
provide a hazard map, which serves as a prior for self-driving cars,
enabling them to adjust driving speed and processing thresholds.
In this paper, we present a method to derive such a hazard
map using lidar mobile mapping. Pedestrians and cyclists are ob-
tained from a sequence of point clouds by segmentation and clas-
sification. Their locations are then accumulated in a grid map,
which serves as a “heat map” for possible hazardous situations.
To demonstrate our approach, we generated a map using lidar
mobile mapping, obtained by twelve measurement campaigns in
Hanover (Germany). Our results show different outcomes for the
city center, residential areas, busy roads, and road junctions.
Introduction
According to the global status report on road safety by the
World Health Organization (World Health Organization,
2013), road traffic injuries are the eighth leading cause of
death; 1.24 million people die annually as a result of a road
injury, and 27% of the road deaths are pedestrians and cy-
clists. In low- and middle-income countries this number even
goes up to one-third of all fatalities. Nowadays, there is the
vision that automated, self-driving cars will help to reach the
goal of zero traffic accidents.
The observation of human behavior in traffic contributes
to the solution of this problem. Humans will perform much
better if they act in a familiar environment, especially if they
know it from their daily commute and have observed possibly
hazardous situations at certain locations in the past. Hence, it
is not only the static “background” information, which helps
them to master the current situation but also the knowledge
of areas which are more risky than others due to regular
local events, such as accidents or dangerous situations. Even
though this knowledge is just a prior, it helps to reduce the
risk of such situations. With regard to vehicles, it means that
they have to analyze their environment continuously. Sen-
sors like laser scanners or cameras can map dynamic objects,
namely pedestrians and cyclists that occur in traffic scenes.
The on-board computer interprets the data and stores the
crucial information in a joint map of all vehicles in a certain
region. In this paper, we call this map a hazard map. Howev-
er, the benefit of this map is not only restricted to driver as-
sistance systems. It can also be used in public transportation
planning, such as the determination of bus stops, where the
knowledge of high pedestrian occurrence is very helpful.
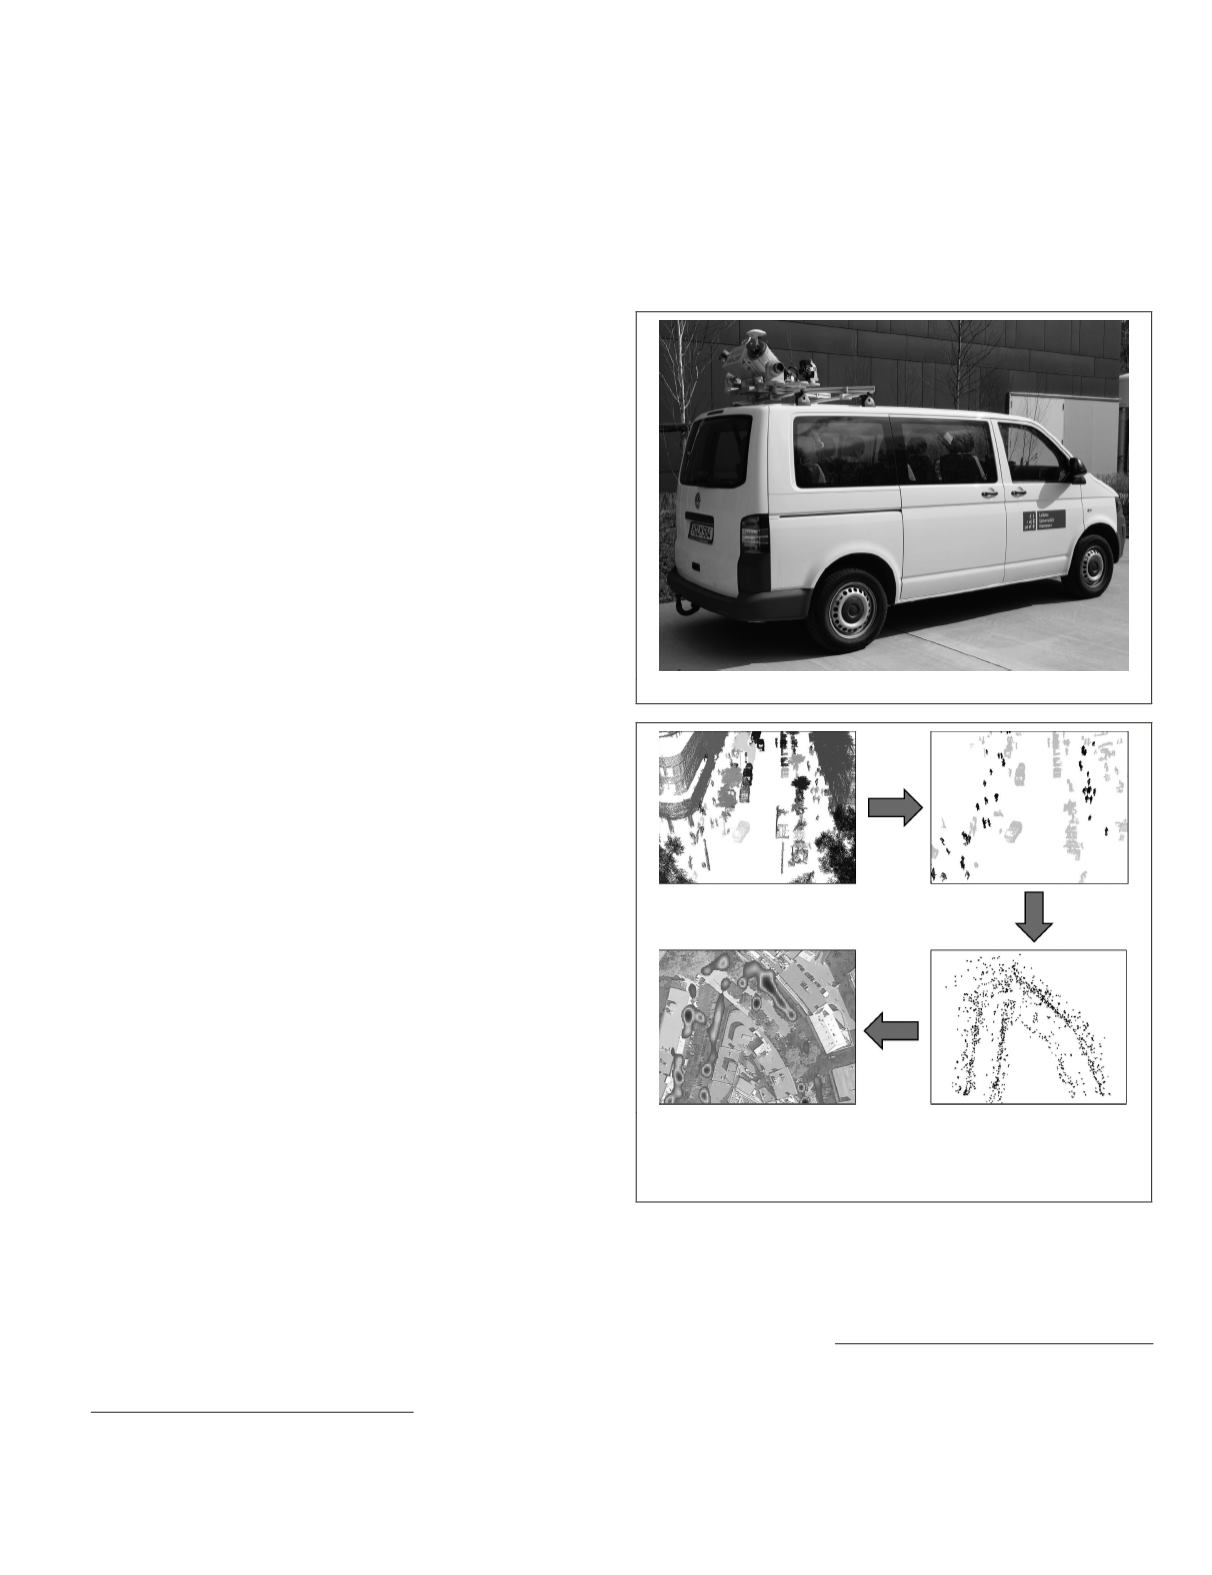
We created an initial hazard map by using lidar data mea-
sured by a Mobile Mapping System as shown in Figure 1. We
chose a lidar system because of its high accuracy combined
with a high spatial resolution. To collect a sufficient amount
of data, we took 12 measurements drives of the same 13 km
trajectory in Hanover (Germany). The principle procedure is
shown in Figure 2. In a first step, we segmented free-stand-
ing objects of every measurement. We looked at the extent
of these objects and removed those whose width and height
is not appropriate. In the next step, we used certain features
describing the shape of the remaining objects for a pedestrian
Leibniz Universität Hannover, Institute of Cartography and
Geoinformatics, Appelstr. 9A, 30167 Hannover, Germany
(
).
Photogrammetric Engineering & Remote Sensing
Vol. 82, No. 12, December 2016, pp. 967–972.
0099-1112/16/967–972
© 2016 American Society for Photogrammetry
and Remote Sensing
doi: 10.14358/PERS.82.12.967
Figure 1. Mobile Mapping System Riegl VMX-250 mounted on a van.
Figure 2. Steps of the hazard map generation: First, free-standing
objects were segmented and classified as being pedestrians/cyclists
or not. Next, classified dynamic objects of 12 measurement drives
were aggregated and then saved in a map (Google, Inc., 2015).


