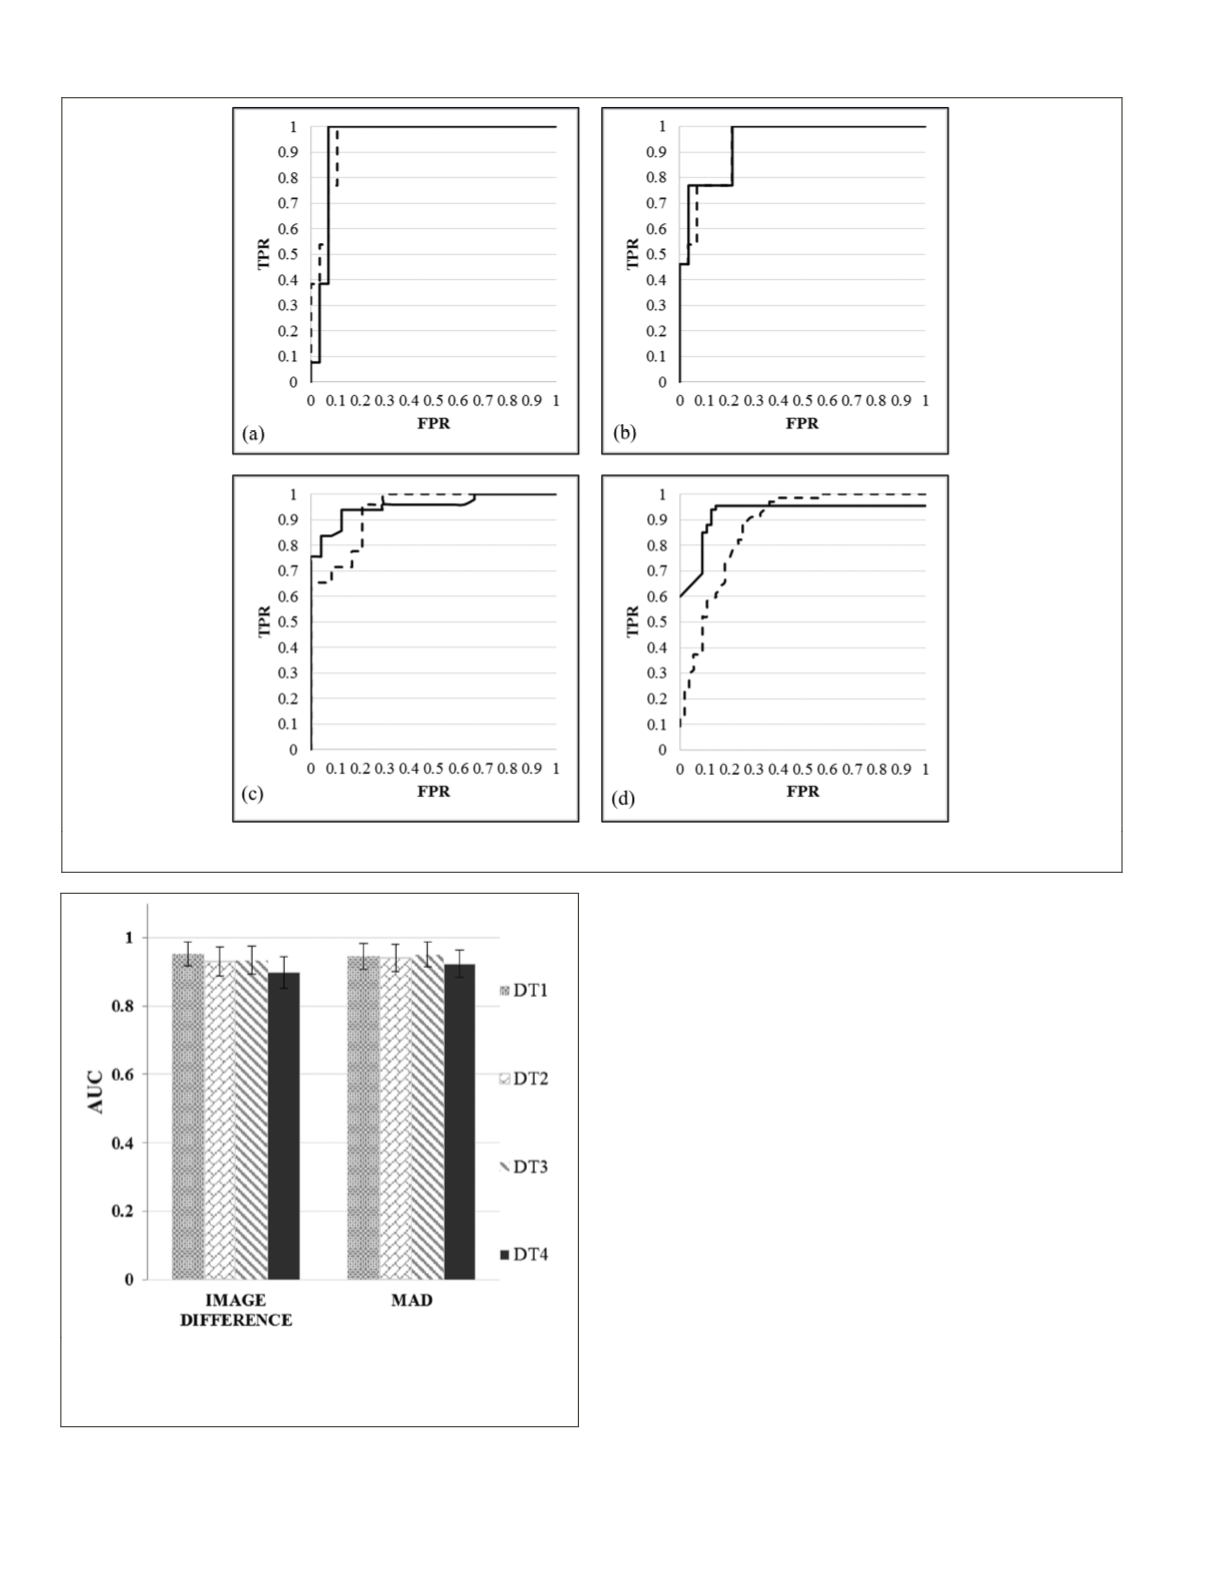
Figure 12. Change detection performance of the two change criteria tested in this study: Image Differencing and MAD Transform, pre-
sented in ROC curves, for datasets: (a) DT1, (b) DT2, (c) DT3, and (d) DT4
Still, since the Area Ratios in the
PWCR
method are not equal
to one (ideal case), there exists contamination of the neighbor
segments in each target image patch generated by
PWCR
. This
contamination is referred to as sliver polygons in the litera-
ture related to
GIS
-based change detection methods (Blaschke,
2005). A portion of this contamination is due to the uncertain-
ty in the position of the exact edge pixels and the rest is due
to errors in
DSM
,
RPCs
, and GCPs. To reduce this error, we used
the mean value of the pixels in each patch as a representation
of the patch for change detection. This can slightly compensate
for the mentioned contamination of the neighbor pixels.
Referring to Figure 8d as an example of misregistration er-
ror in the conventional method, the size of the sliver polygons
generated by the conventional method is far greater than the
size of the sliver polygons generated in
PWCR
. This is because
the borders transferred to the target image using the conven-
tional method do not properly fit the actual object borders
due to the unsolved geometric distortion problem. However,
since the patches are regenerated in the
PWCR
method consid-
ering the geometric properties of the images, better overlap of
the patches and actual borders are attained. Therefore, lower
sizes of sliver polygons and higher accuracies in coregistra-
tion are achieved by our method.
Furthermore, unlike other 3D-based change detection
methods, in this study, only one
DSM
is required. Neverthe-
less, the accuracy of
DSM
highly affects the coregistration
accuracy. A
DSM
with accuracy better than or similar to the
spatial resolution of the images can produce accurate coreg-
istration results. A detailed lidar-generated
DSM
could be a
Figure 13. Area Under the Curve of the two change detection cri-
teria tested in this study: Image Differencing and MAD Transform
for datasets DT1 to DT4. The vertical black lines represent the 95
percent confidence intervals of the values.
532
July 2016
PHOTOGRAMMETRIC ENGINEERING & REMOTE SENSING


