images was clearly significant. Thus, leaving the shaded area
untreated may significantly underestimate impervious sur-
face, especially when using the winter image.
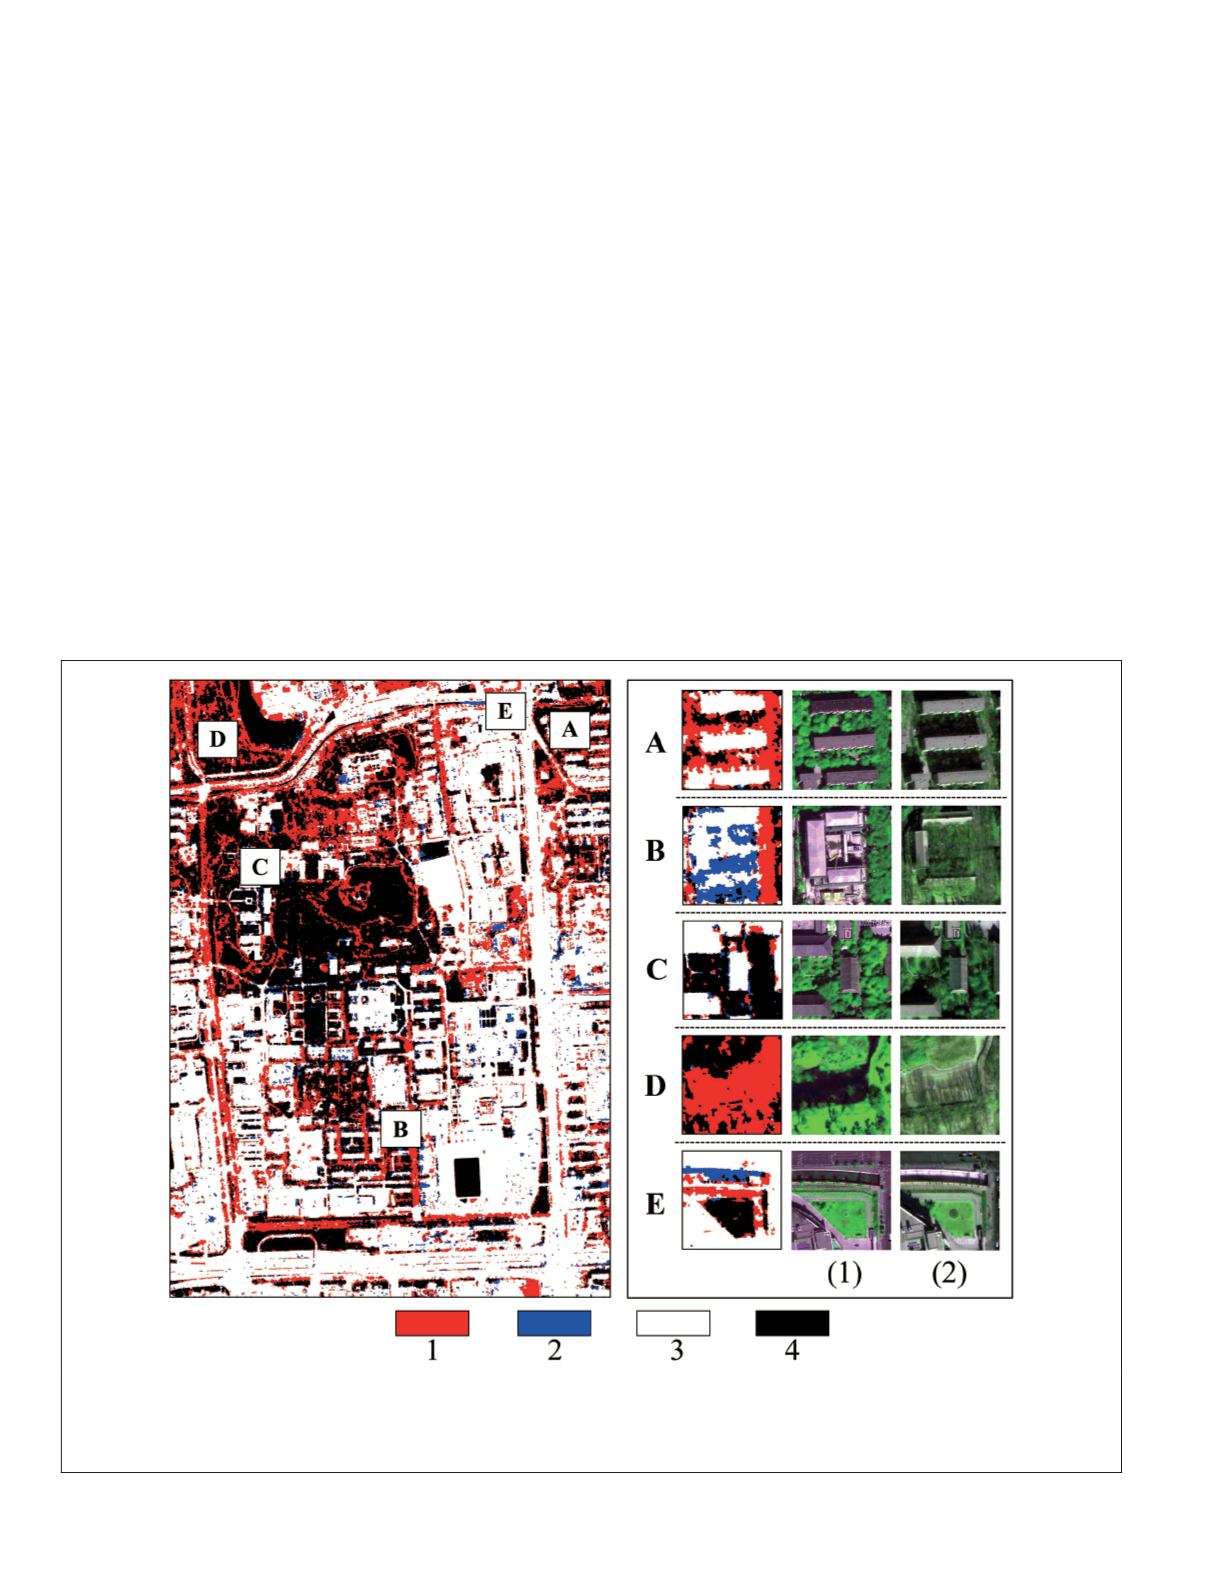
The spatial distribution of difference in the impervious
surface extraction from the summer and winter images is
shown in Plate 5. The total area of the difference (i.e., with
different class labels from summer and winter images) ac-
counts for 23.63 percent of the entire image. From the Plate,
the major difference between two season results (i.e., 20.76
percent of the entire image) is in the areas classified as pervi-
ous surface from the summer image and impervious surface
from the winter image (i.e., the red area in Plate 5). Specifi-
cally, this type of difference is mainly distributed on roads,
sidewalks, and around buildings (e.g., Plate 5A and 5B). The
difference is largely caused by seasonal variation of decidu-
ous trees, that is, the areas obscured by deciduous tree cano-
pies in the summer image and exposed as impervious surface
in the winter image.
The minor difference between the extraction results from
the two seasons (2.87 percent of the entire image) is in the
areas which were classified as impervious surface from the
summer image and pervious surface from the winter image
(i.e., the blue area in Plate 5). This kind of difference has a
scattered and fragmented distribution. We found from careful
inspection that the difference resulted mainly from land cover
changes, e.g., construction (grass areas changed to build-
ings in Plate 5B), and from variations in the view angle and
the illumination between the two seasons (Plate 5C). Some
additional difference is caused by classification errors in
both images. For example, in Plate 5D the classification error
is mainly caused by the misclassification of the area as an
impervious surface (shown in red) in the winter image result,
while in Plate 5E the classification error is mainly produced
by the misclassification of water as an impervious surface
(shown in blue) in the summer image result.
Impervious Surface Mapping Results for the Tianjin Area
For the Tianjin area, 1,000 validation pixels were initially se-
lected using the stratified random sampling method, and 998
pixels were finally used for the accuracy assessment. A total
of 727 pixels of impervious surface and 271 pixels of pervi-
ous surface were used for the evaluation of the result from the
summer image. A total of 902 pixels of impervious surface
and 96 pixels of pervious surface were used for the evaluation
of the winter image result. Samples with the same locations
but assigned different class labels for the two seasons ac-
counted for approximately 18.94 percent (189 pixels in total)
of all validation samples.
The population error matrices and accuracies of the final
impervious surface extraction from the summer and winter
images are shown in Table 6. The results from both season
images achieved high overall accuracies: 94.68 percent for the
summer image and 94.03 percent for the winter image. For
the accuracies of individual classes, both impervious surface
Plate 5. Difference map of impervious surface extraction between summer image and winter image and selected details.1, the area
recognized as pervious surface from the summer image and as impervious surface from the winter image; 2, the area recognized as im-
pervious surface from the summer image and as pervious surface from the winter image; 3, the area with the same impervious surface
class label; 4, the area with the same pervious surface class label. Rows A through E show the details of difference map. Columns (1)
and (2) denote the subsets of the summer and winter images.
344
May 2016
PHOTOGRAMMETRIC ENGINEERING & REMOTE SENSING


