demand. The fit of the models is also reasonably strong. The
models predict the actual user’s first choice correctly between
74 percent and 85 percent of the time depending on the
model. Within the set of survey respondents, the largest set of
responses was
No/No
(a No response to the first bid amount
they were asked to pay and a No response to the second lower
bid amount they were asked to pay). The next largest set of
responses was
Yes/Yes
(Yes to the first bid amount they were
asked to pay and a Yes response to the second higher bid
amount they were asked to pay). There were smaller propor-
tions of
No/Yes
and
Yes/No
.
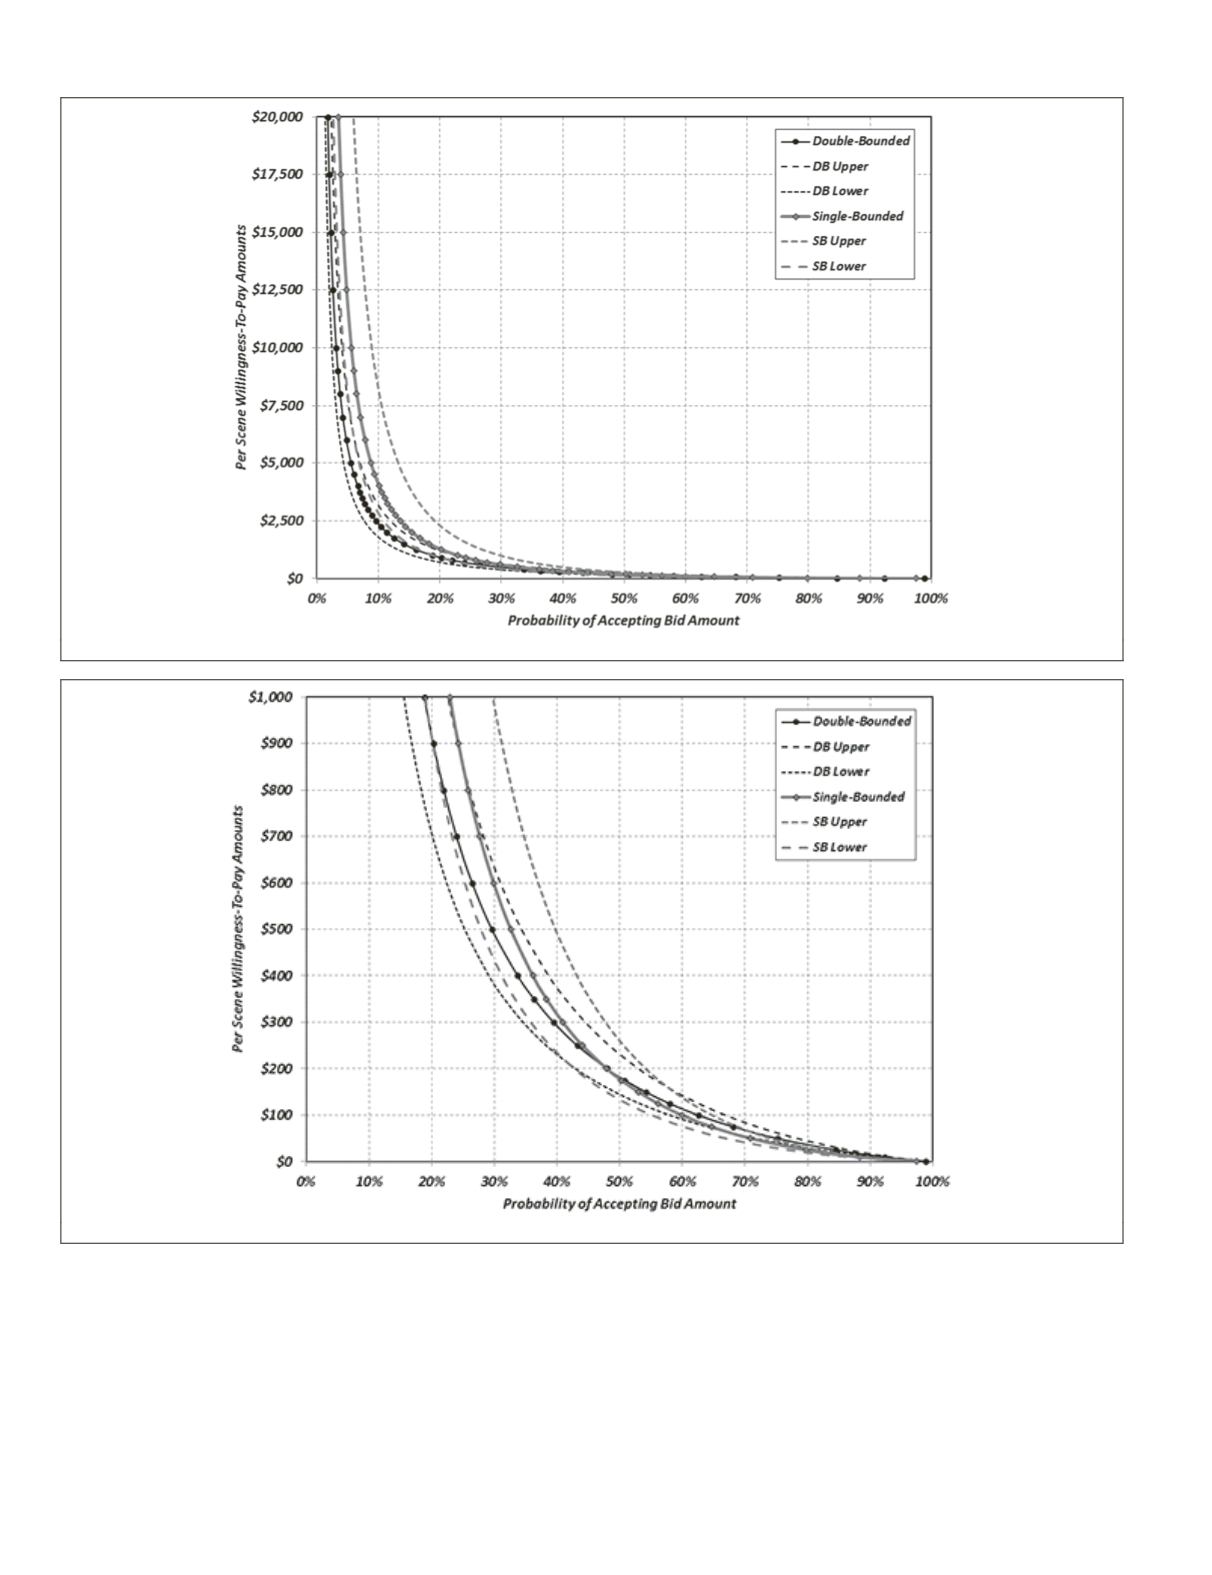
Figures 1 and 2 present the quasi demand function for
Landsat satellite imagery aggregated by percentage across all
sector types for US established users. Figure 1 is the function
represented across all bid amounts presented to survey respon-
dents. The functions associated with both the single-bounded
model and the double-bounded model, as well as associated
confidence intervals, are presented. The single-bounded and
double-bounded are visually rather similar, but the confidence
interval is noticeably narrower for the double-bounded model,
as expected. Figure 2 zooms into the lower bid amounts so that
the bid amount for the median
WTP
can be observed. As can
Figure 1. Logit Function Demand Curve for Landsat imagery for the Full Range of Alternative Bid Amounts asked of US Established Users.
Figure 2. Logit Function Demand Curve for Landsat Imagery Expanded View of the Low-Bid Range for US established users.
652
August 2015
PHOTOGRAMMETRIC ENGINEERING & REMOTE SENSING


