BCE
measures the consistence between the segmentation
result and the reference. At first, the local refinement error
(
LRE
) is defined to measure the degree to which the reference
(
R
) and the segmentation (
S
) agree at a pixel
p
i
:
LRE S R p
B S p B R p
B S p
i
i
i
i
( , , )
,
\ ,
,
=
( ) (
)
( )
(4)
BCE
N
LRE R S p LRE S R p
i
i
i
N
=
{
}
=
∑
1
1
max ( , , ),
( , , )
(5)
where
B
(
A
,
p
) is the segment in the partition
A
that contains
point
p
, and ∙\∙ denotes the set difference. For example,
B
(
R
,
p
)\
B
(
S
,
p
) denotes the set of pixels {
p
|
p
∈
B
(
R
,
p
),
p
∉
B
(
S
,
p
)}. In the over-segmentation case,
LRE
(
S
,
R
,
p
i
) is large, and
LRE
(
R
,
S
,
p
i
) is small, and in the under-segmentation case,
by contrast,
LRE
(
S
,
R
,
p
i
) is small, and
LRE
(
S
,
R
,
p
i
) is large.
In order to address the sensitivity to both over- and under-
segmentation,
BCE
is defined to adopt the larger local error
at each pixel and combine all the
N
pixels within the image.
Moreover, an accuracy map can be generated by presenting the
local error at each pixel, as shown in Figure 8 and Figure 9.
BCE
N
LRE R S p LRE S R p
i
i
i
N
=
{
}
=
∑
1
1
max ( , , ),
( , , )
(6)
D
sym
is defined as the minimal proportion of pixels
that must be removed from both the reference and the
segmentation result so that
the remaining pixels are identical.
The indicator of
ARI
is the measure of correspondence
between the segmented result and the reference; it evaluates
the degree of agreement of two partitions based on the
comparison of object triples, i.e., how the three distinct
objects are delineated by the two partitions. All the three
indicators are sensitive to both over- and under-segmentation,
and range from 0 to 1. The lower
BCE
and
D
sym
values and the
higher
ARI
value indicate the better segmentation quality.
The Effectiveness of NF
0
and β of AISP on Scale Coverage
In this subsection, we focus on analyzing the effectiveness
of the initial normalized factor
NF
0
and the decreasing rate
β
on the involvement of the scale parameters, which indicates
how to set
NF
0
and
β
properly. The number of regions (
NR
) is
used to indicate the segmentation scale. A segmentation with
more regions is considered at finer scale than that with fewer
regions. The experiments have been performed extensively
on several images; the test image T1 is selected as a sample to
illustrate the findings.
(a)
(b)
Figure 4. The references of the test images T1 (a) and T2 (b). There are 165 and 106 reference objects in T1 and T2, respectively.
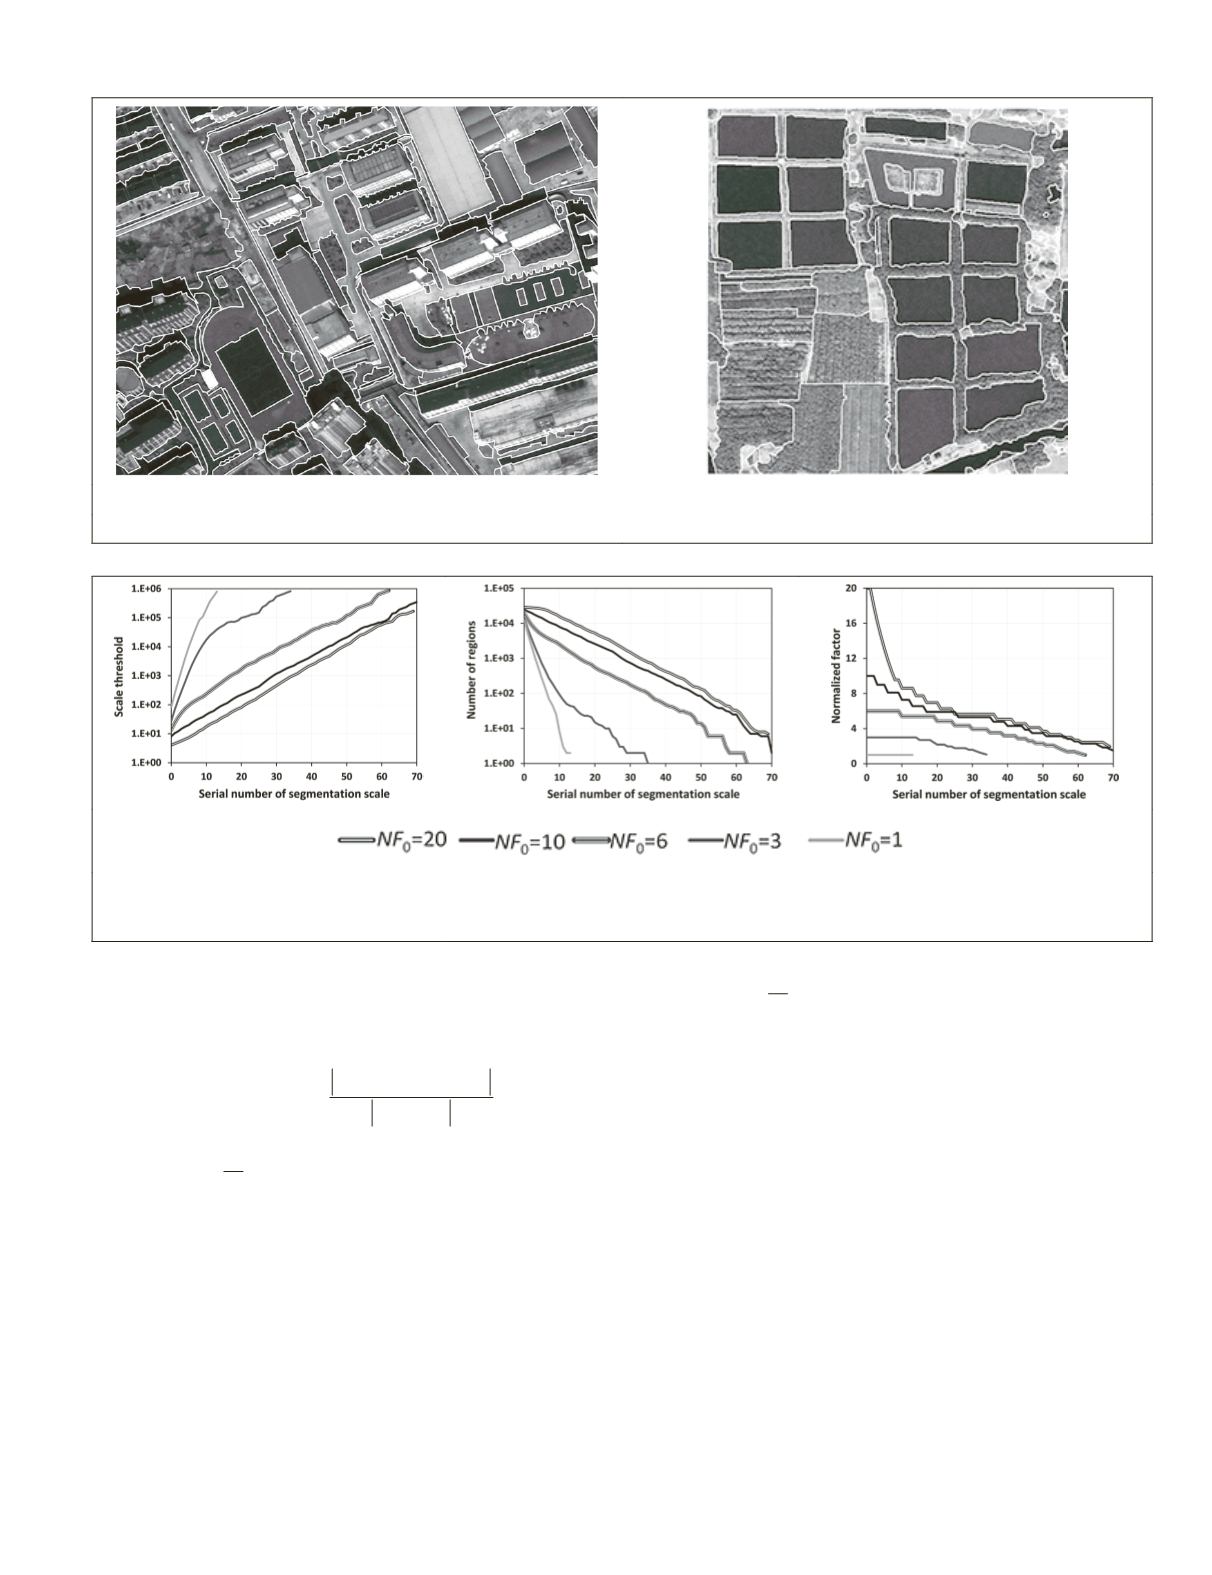
Figure 5. Evolution curves of the (a) scale threshold (
S
k
), (b) number of regions (
NR
) in segmentation, and (c) normalized factor (
NF
k
) as
the serial number of segmentation scale (
k
) increases by applying LMM on test image T1. The decreasing rate (
β
) is set as 0.9 and the
initial normalized factor (
NF
0
) is set differently.
PHOTOGRAMMETRIC ENGINEERING & REMOTE SENSING
June 2015
465


