recorded between 1999 and 2012, only within fire hazard
classes, and excluding fires in agricultural lands. When
analyzing the distribution of the fire-affected areas over the
different fire hazard classes it was found that 73.4 percent
of fire affected areas fell within the class of high fire hazard,
followed by 23.3 percent within moderate hazard. The class
low fire included 0.3 percent of the fire-affected areas, while
the class very high fire hazard included 3 percent of the fire-
affected areas. Although the distribution of burned areas is
comparable to fire hazard classes, a larger temporal extent of
fire datasets would improve assessment of the results.
An overall vulnerability map was derived from the previ-
ously discussed demographic vulnerability and the forest
vulnerability maps. The spatial distributions of each category
of the overall vulnerability map were produced. Only five out
of 1604 cadastral units were characterized as highly vulner-
able to wildfire, whereas 566 cadastral units were character-
ized as moderately vulnerable to wildfire (Figure 4). This
was explained by a more detailed investigation of the classi-
fied Lebanese cadastral units showing that (a) 96 percent of
the units were classified as low demographic vulnerability,
and (b) 65 percent as low forest vulnerability, 30 percent as
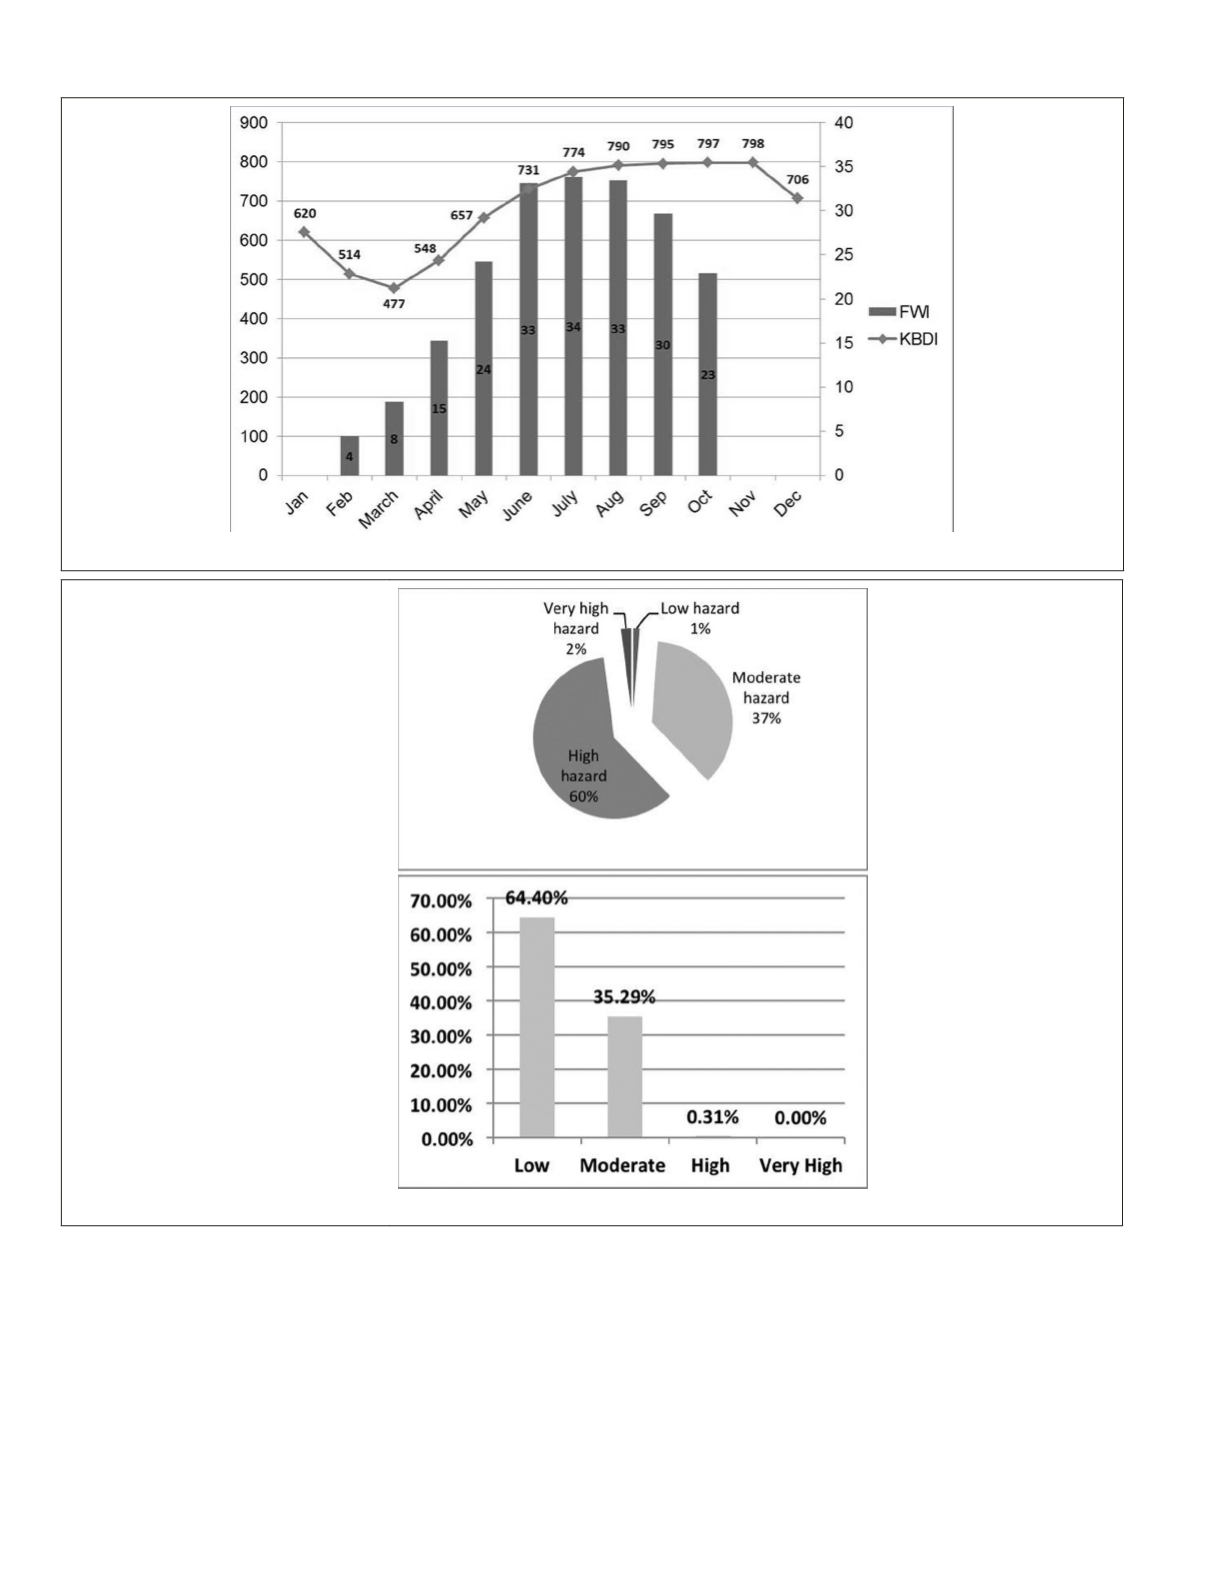
Figure 3. Comparison between monthly
kbdi
averages for Lebanon and monthly FWI averages for the Eastern Mediterranean.
(a)
(b)
Figure 4. (a) Spatial distribution of wildfire hazard classes, (b) distribution of cadastral units in function of overall wildfire vulnerability.
504
June 2015
PHOTOGRAMMETRIC ENGINEERING & REMOTE SENSING


