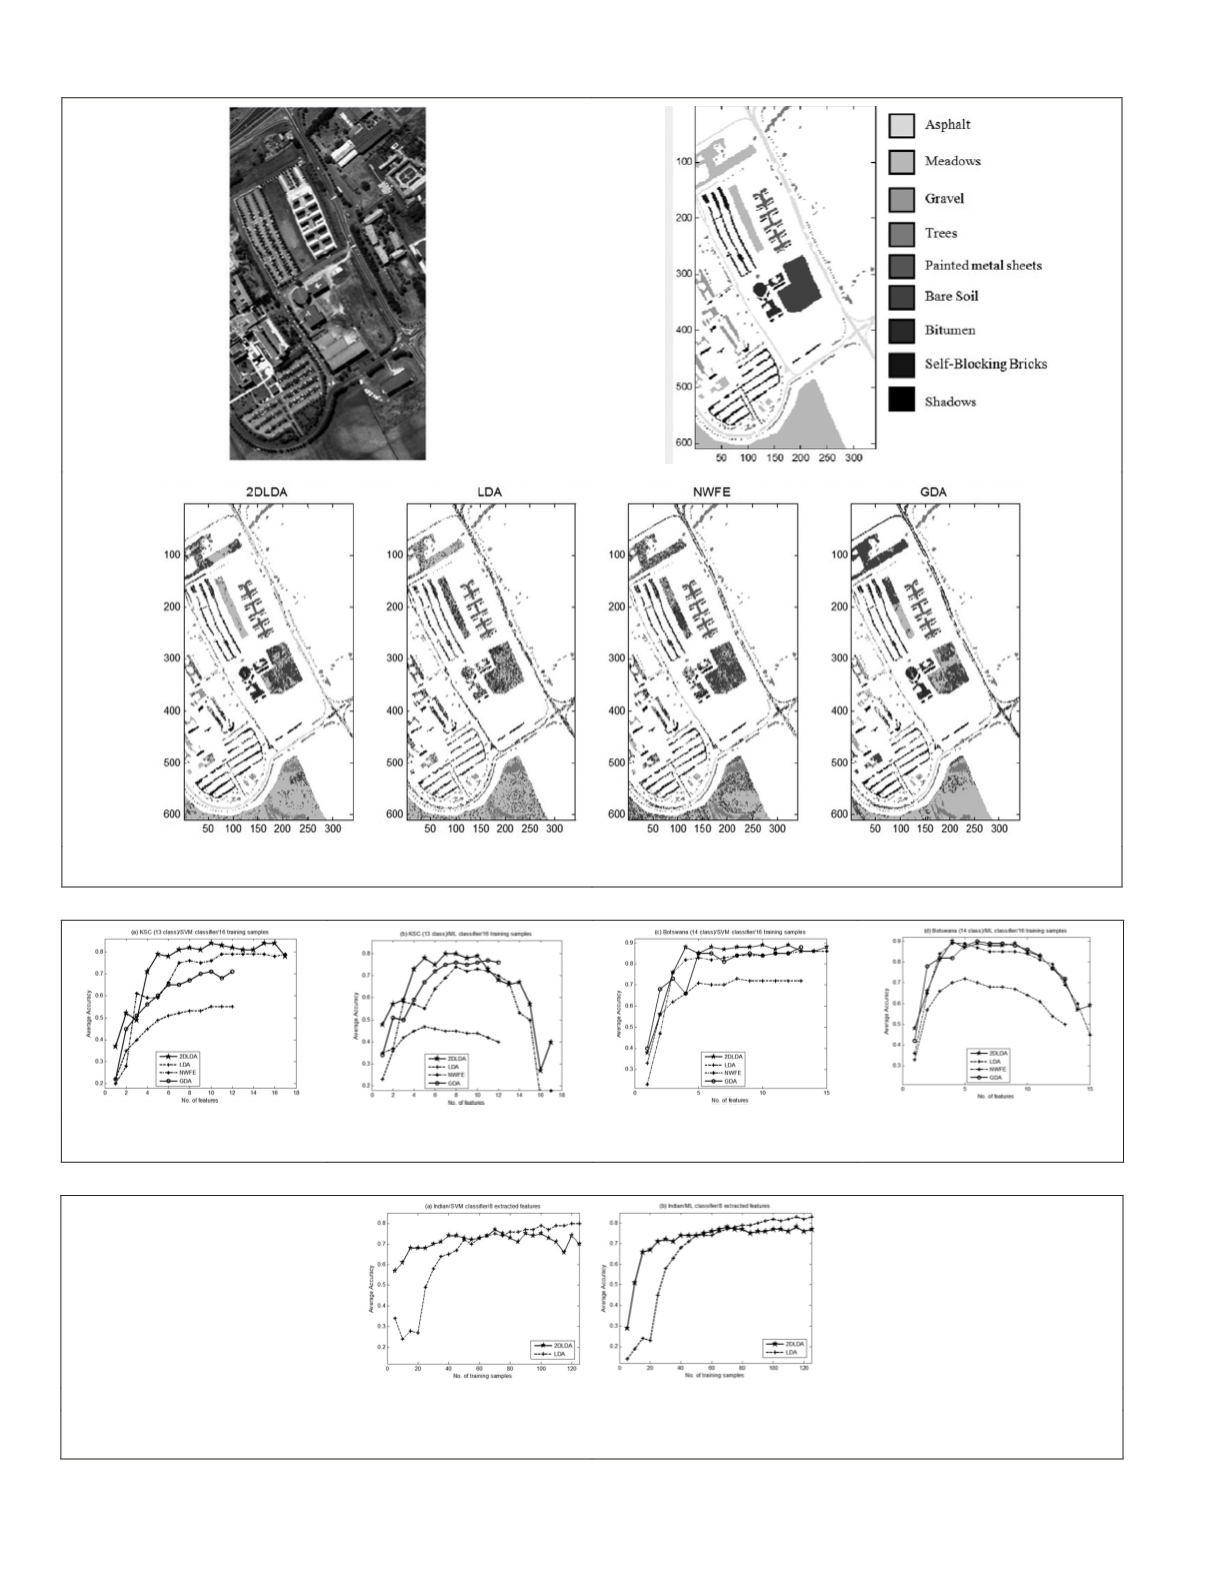
Figure 5. The top row: overview of the Pavia area, from left to right: Pseudo-color image and reference data map. The bottom: the clas-
sification maps of the Pavia dataset obtained by the SVM classifier, 16 training samples, and 6 features.
Figure 6. The average accuracy obtained by (a) the SVM classifier for the KSC dataset, (b) the ML classifier for the KSC dataset, (c) the
SVM classifier for the Botswana dataset, and (d) the ML classifier for the Botswana dataset with using 16 training samples.
(a) (b)
Figure 7. The comparison of 2DLDA with LDA using eight extracted features in different number of training samples by the (a) SVM, and
(b) ML classifiers for the Indian dataset.
784
October 2015
PHOTOGRAMMETRIC ENGINEERING & REMOTE SENSING


