sixth and seventh transects (Figure 1 transects are explained in
the next paragraph). The river banks are covered mainly by So-
phora (
Sophora alopecuroides
L), a local shrub species grazed
by sheep and camels. In addition, there are several other grass
species present in this area. However, due to their extremely
low densities, these species are less likely to influence our
results and were not included in the classification procedures.
A QuickBird image (DigitalGlobe, Inc., Colorado) of the
study area was acquired on 25 July 2012. The multispectral
image has a blue, green, red, and
NIR
band (center wave-
lengths are 488 nm, 543 nm, 650 nm, and 817 nm, respec-
tively) with a pixel size of 2.4 m; the panchromatic image has
a pixel size of 0.6 m (DigitalGlobe, Inc. Colorado). Geometric
correction for both multispectral and panchromatic images
was provided by DigitalGlobe Corporation. The multispectral
bands were resampled to 0.6-meter pixels using a cubic con-
volution method (ENVI, Exelis, Inc., Colorado).
Field data sampling was conducted at the study site from
14-20 July 2012. Seven transects, perpendicular to the river
channel, were laid on both sides of the riverbed (Figure 1).
Four 50 m × 50 m plots were set up along each transect ap-
proximately 100 m apart from each other. Training and testing
polygons were collected both in these plots and from the sat-
ellite image (Table 1). Polygons of saltcedar, cottonwood, and
Sophora were recorded within the plots using a GeoXM®
GPS
unit (Trimble Navigation Limited, California), while polygons
for soil, roads, and shadows were manually digitized on the
QuickBird image.
Methods
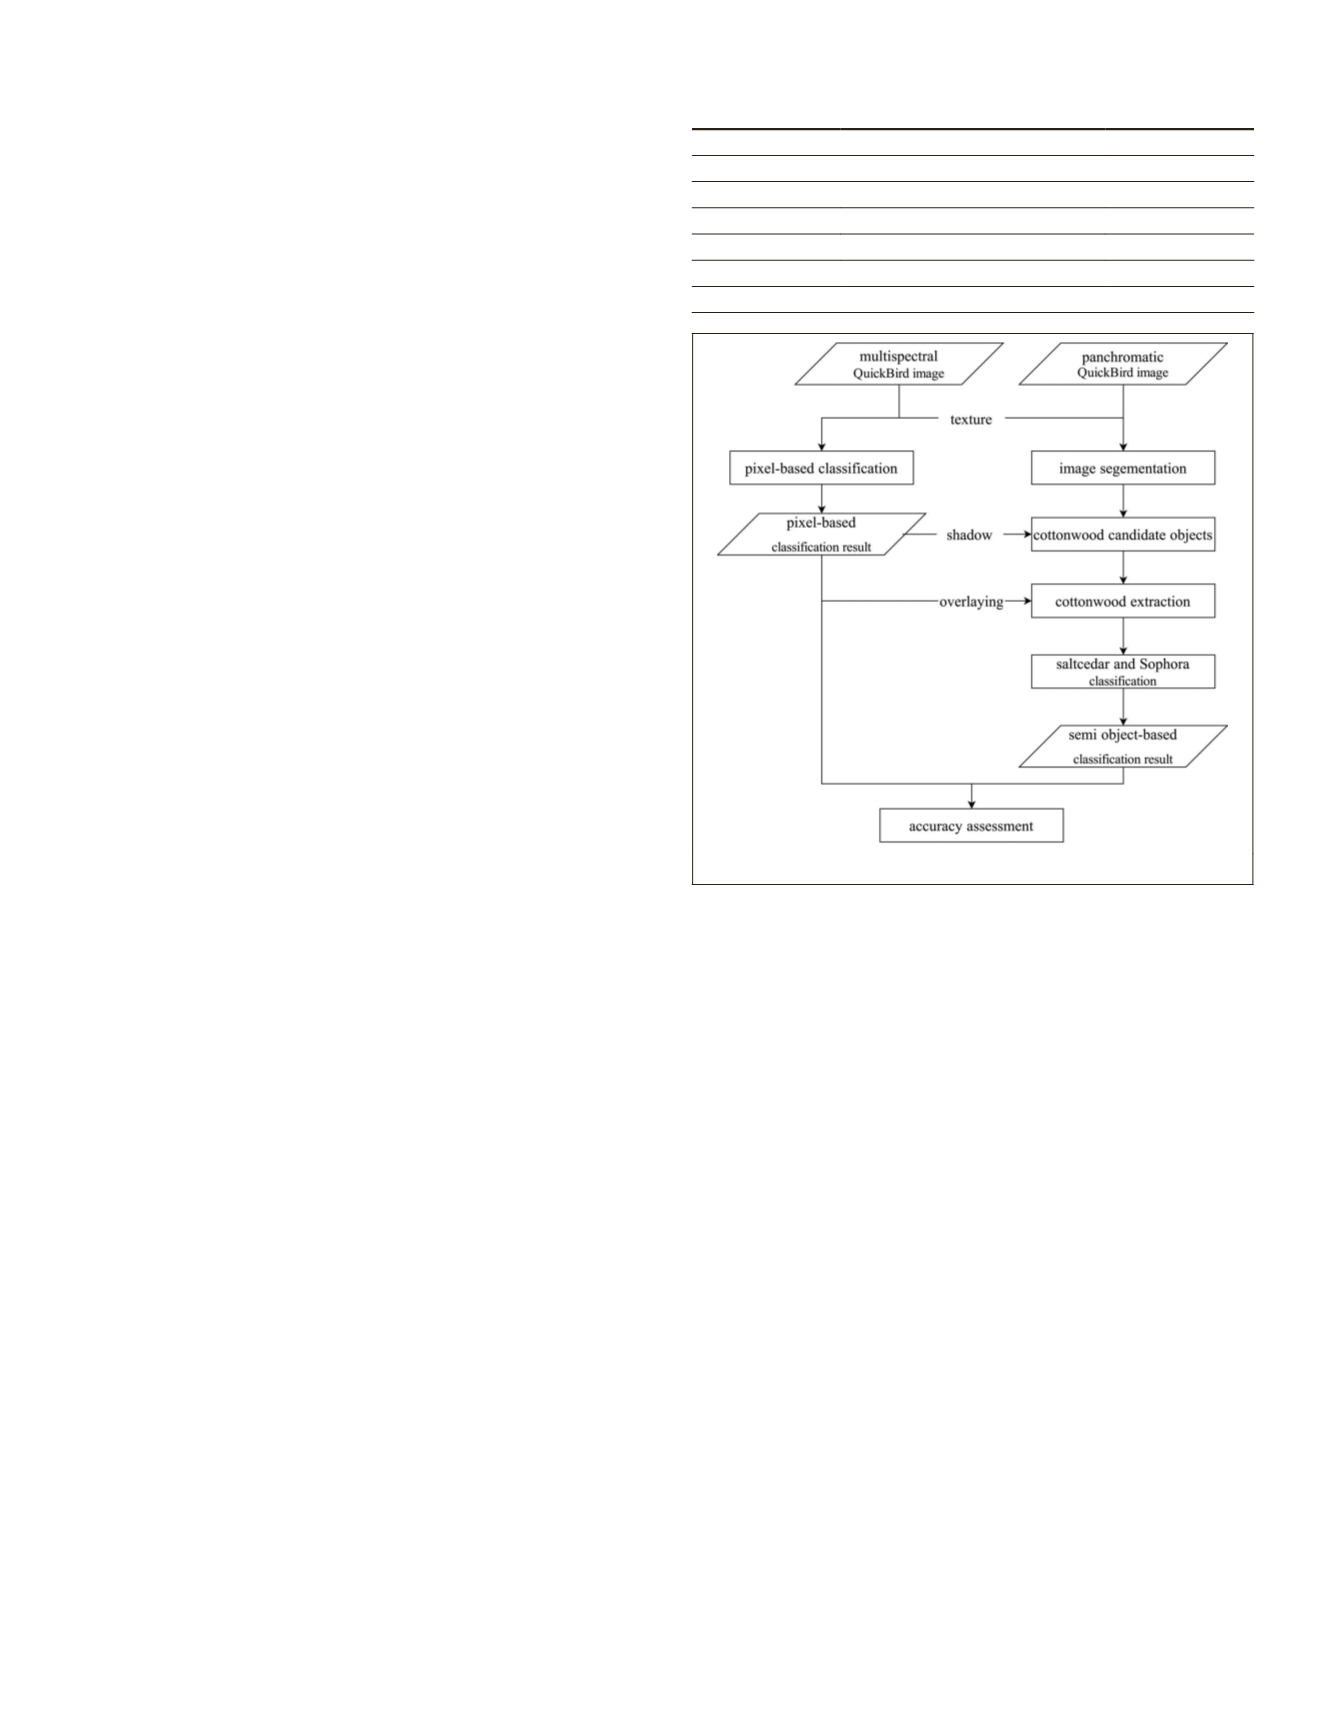
Both traditional pixel-based algorithms and a semi object-
based method were used to classify cottonwood, saltcedar,
and Sophora in our study area (Figure 2).
Pixel-based Classification (Maximum Likelihood Classifier and Support
Vector Machine)
Maximum likelihood classifier (
MLC
) and support vector
machine (
SVM
) were used as the two pixel-based classifica-
tion methods. In addition to the spectral information from
the multispectral image, texture measures extracted from the
panchromatic image were also used in pixel-based classifica-
tion and will be discussed in the next Section.
The traditional probability-based parametric
MLC
classifies
each observation (an image pixel) based on the probability
function established from the estimated mean and variance
from the training samples (Bishop, 2006). However, in
MLC
, a
normal distribution of the training data, which usually cannot
be met in remote sensing images, is always assumed. Never-
theless, we used
MLC
results as a benchmark, since it probably
is the most commonly adopted parametric classifier in remote
sensing (Lu and Weng, 2007).
Unlike
MLC
,
SVM
is a non-parametric machine learning
technique for classification, regression, and novelty detection
(Bishop, 2006). It has been reported to outperform most other
classification algorithms in many remote sensing applications
(Mountrakis
et al
., 2011; Pal and Mather, 2005). For the
SVM
used in this study, a Radio Basis Function (
RBF
) was adopted
as the kernel function. The penalty and kernel parameters
were optimized through a cross-validation procedure.
Texture Measures
In addition to spectral information provided by the mul-
tispectral image, high spatial resolution of the QuickBird
panchromatic data allows the image to capture subtle tonal
differences among different species. For example, individual
and small clusters of saltcedar, when distributed within a
large Sophora patch, would appear to have a rougher surface
than their neighbors in the remote sensing image due to their
different canopy structures (Figure 3).
To characterize the tonal/texture differences, we used
measures derived from the second order Grey Level Co-occur-
rence Matrix (
GLCM
) (refer to Haralick
et al
., 1973 for detailed
description of
GLCM
and texture measures). Because of its
higher spatial resolution, we used the panchromatic image
to calculate the texture measures. In order to search for the
optimal differentiation among saltcedar, cottonwood, and So-
phora, different window sizes for texture measure extraction
were tested. Huang
et al
. (2009) found correlation, entropy,
variance, and contrast to be the most effective in capturing
the characteristics of the
GLCM
and were chosen in our study
as the four measures of the texture image. Texture measures in
three different directions (horizontal, vertical, and diagonal)
were averaged and stacked with the original multispectral
image to form the spectral-texture data used in the following
classification.
Cottonwood Extraction at Object Level
As stated earlier, saltcedar is very similar to cottonwood in
terms of spectral signature in summer, which is likely to
cause a high misclassification rate between these two species
when only spectral data is used. However, scattered cotton-
wood trees can be distinguished in the QuickBird image by
both their distinct crown boundaries and the shadows they
cast on the ground (Figure 4). Therefore, we developed a
semi-object-based method, which considers both crown shape
and spatial relationship between trees and their shadows, to
segregate cottonwood from saltcedar.
First, image segmentation using the crowns’ shape was
conducted on the panchromatic image (eCognition
®
, Trimble
Navigation Limited, California). Image objects were created
by merging pixels/smaller image objects into larger ones.
T
able
1. T
raining
and
T
esting
S
amples
for
C
lassification
Class
Training (polygons/pixels)
Testing (pixels)
Cottonwood 5/1,520
49
Saltcedar
5/2,909
222
Sophora
5/2,076
92
Soil
5/2,361
73
Road
2/188
7
Shadow
5/104
8
Figure 2. Flowchart of classification methods.
PHOTOGRAMMETRIC ENGINEERING & REMOTE SENSING
October 2015
797


