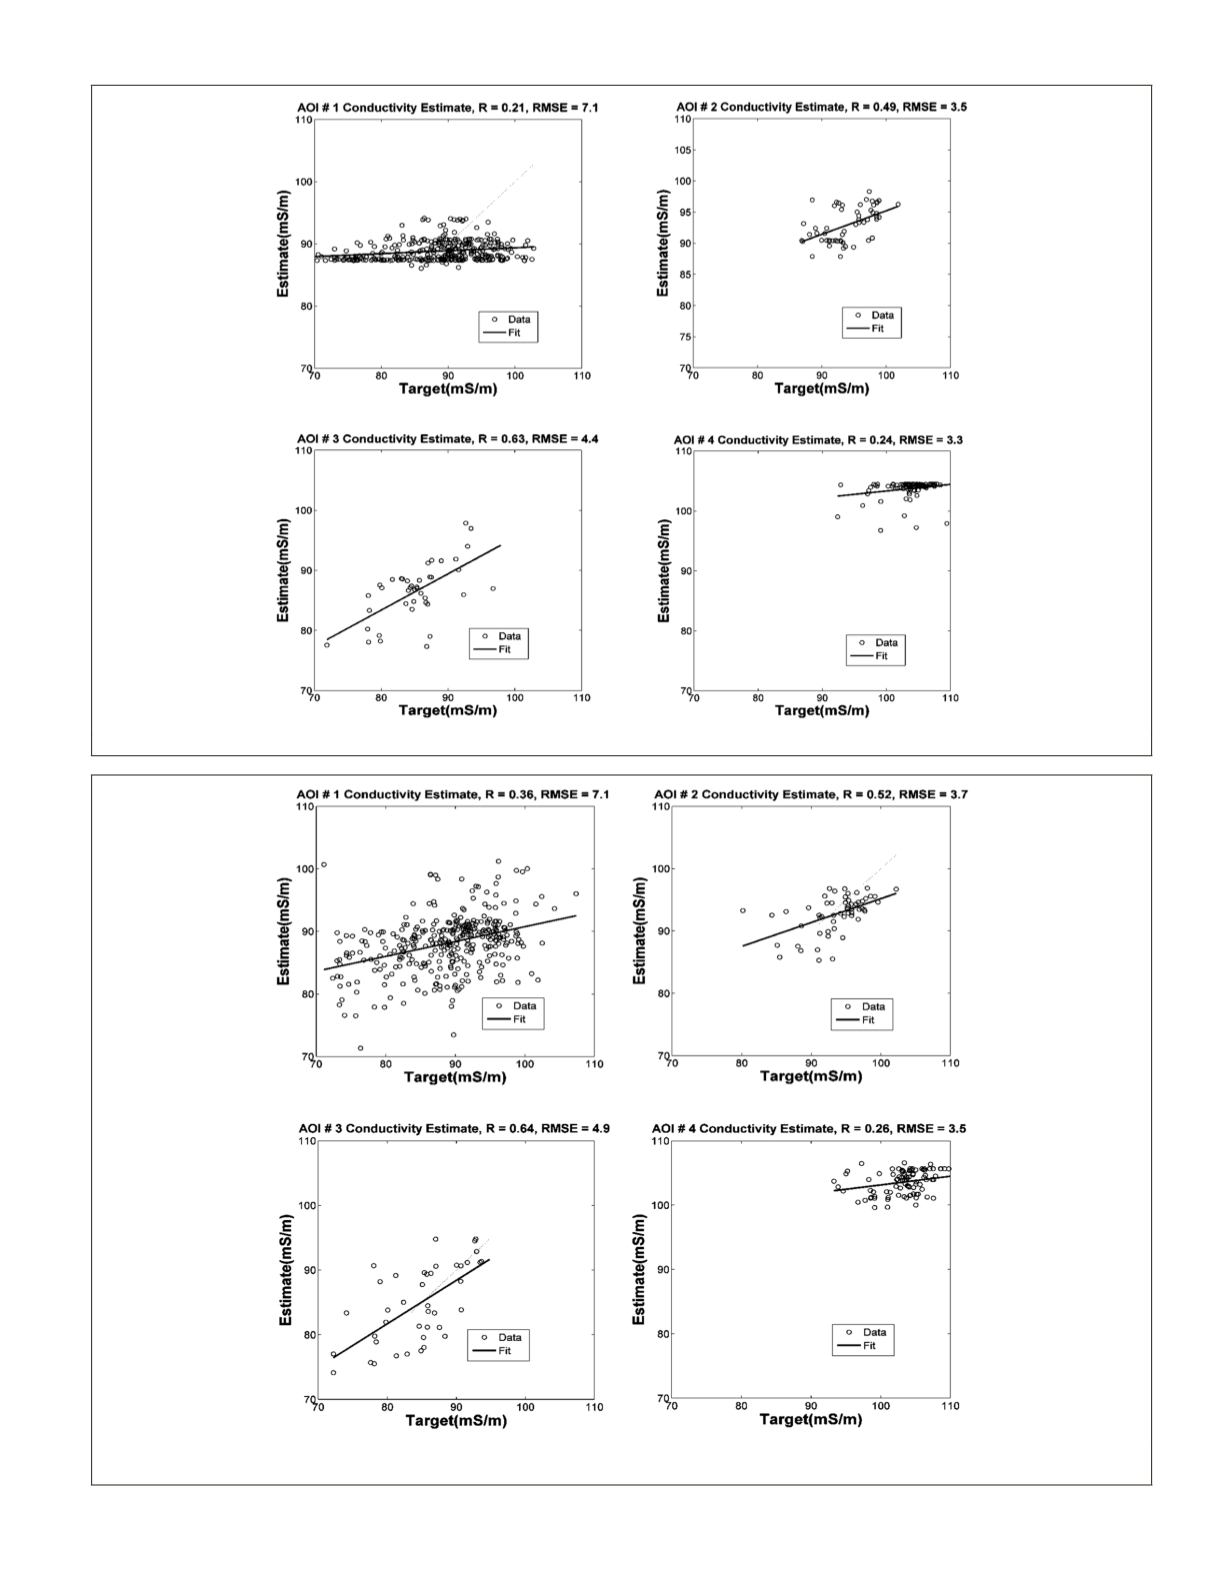
Figure 9. Conductivity estimation for the AOIs in scenario 2 (including a mean of HH and VV on a sliding window in addition to scenario 1 features).
Figure 10. Conductivity estimation for the AOIs in scenario 3(including the mean and standard deviation of the backscatter coefficients in
a sliding window of 5 × 5, and wavelet features for a sliding window (7 × 7) in addition to the scenario 2 features).
PHOTOGRAMMETRIC ENGINEERING & REMOTE SENSING
July 2016
517


