PHOTOGRAMMETRIC ENGINEERING & REMOTE SENSING
June 2014
491
to designate the four
corners of a training
or test polygon. In
comparison to what
we had been used to,
this was a marvelous
advancement and of-
fered a tremendous
improvement for in-
terfacing with the
imagery. (It was this
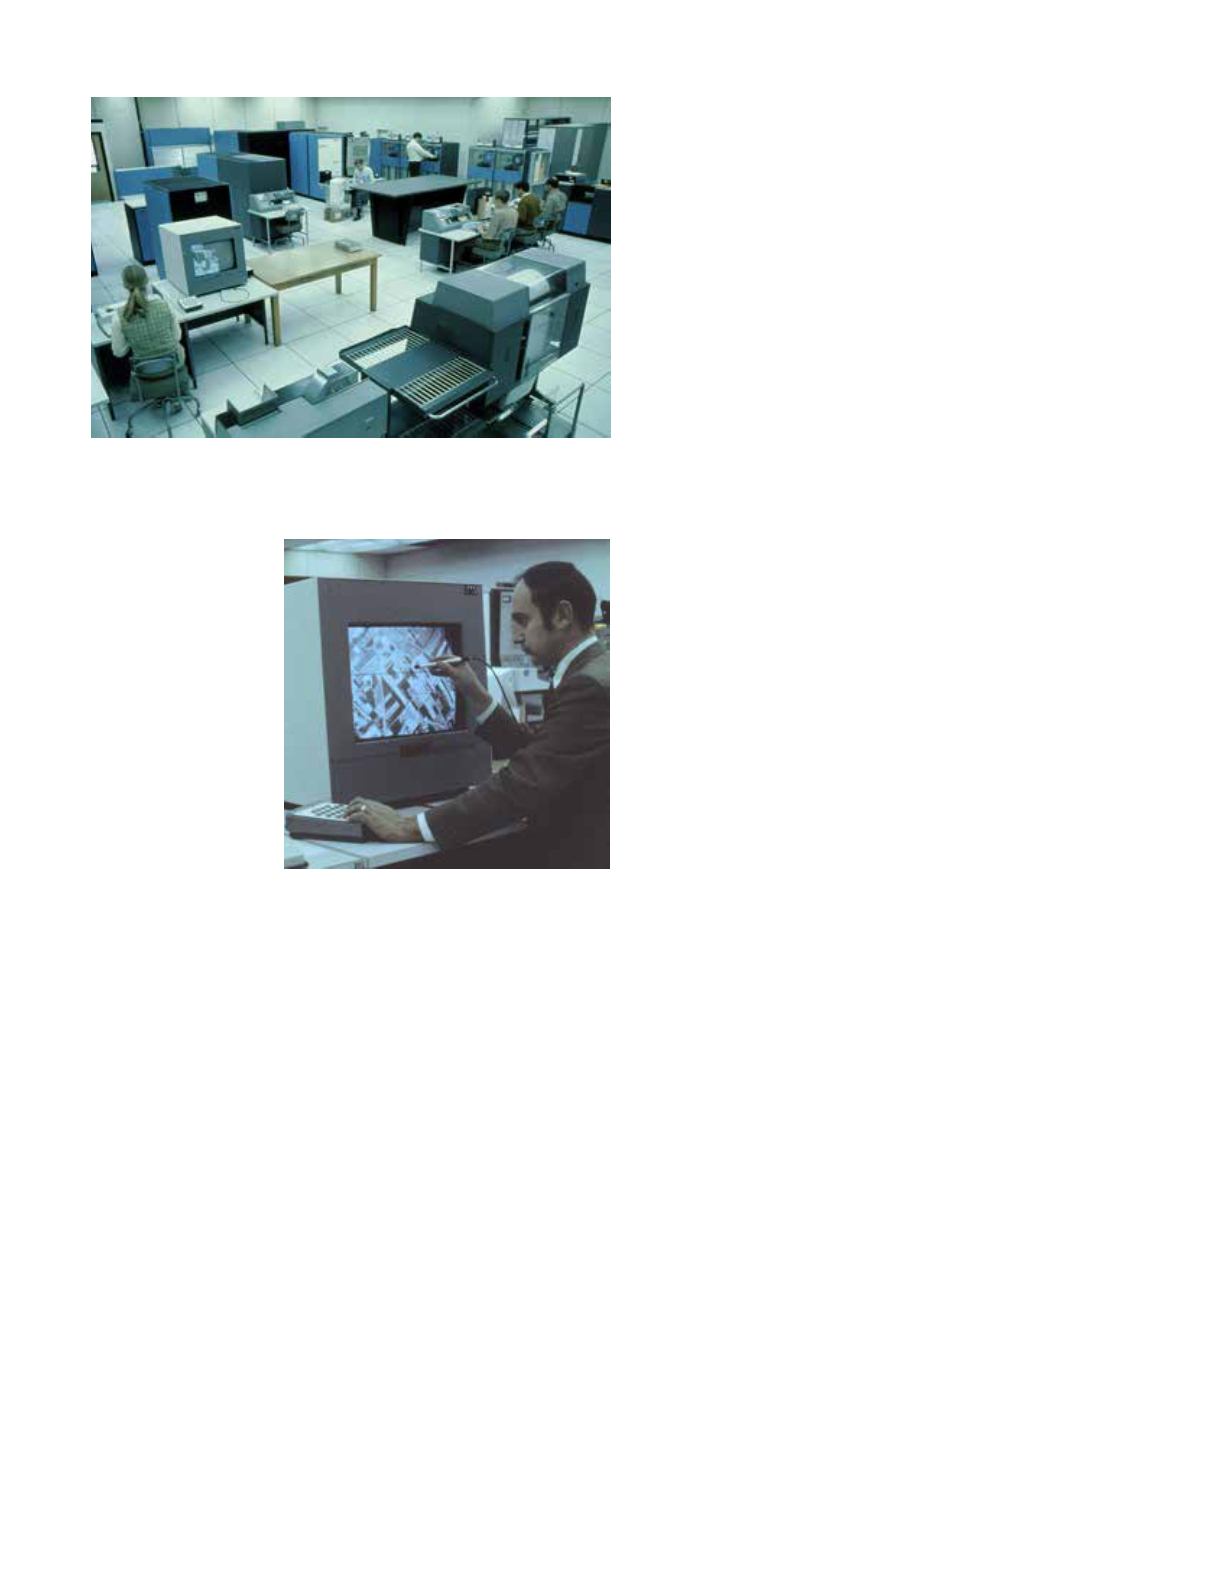
display unit that
was used to analyze
the very first frame
of ERTS-1 [i.e.,
Landsat-1] imagery
in 1972.) Obviously,
computer capabilities continued to develop, and within about
seven or eight years the display unit was obsolete. Shortly
thereafter, IBM asked if it could be returned to them to put
it in the
IBM Museum. Thus, within a period of less than 10
years, this very first digital display device went from being a
“$1,000,000 state-of-the-art” piece of equipment to being a mu-
seum display!
E
xpansion
of
D
igital
A
nalysis
C
apabilities
The late 1960’s and early 1970’s were an interesting, exciting
time of developing a better understanding of how to apply pat-
tern recognition theory to multispectral scanner data. There
was considerable emphasis on the development of effective
analysis techniques such as the use of “supervised” and “unsu-
pervised” training techniques. Different methods of evaluating
the classification results were examined. Various combinations
of wavelength bands and different numbers of wavelength
bands were tested extensively to determine how many bands
and which combination of bands were most effective for vari-
ous cover types and conditions. There was also an increased
level of activity in analyzing multispectral scanner data for
forestry, geologic, water resource and other earth resource ap-
plications. The LARS data processing group developed a set of
software, named LARSYS, which was the first software sys-
tem capable of processing and classifying multispectral scan-
ner data. In 1970, the LARS computer facility was upgraded to
an IBM 360 Model 67 main-frame computer, one of the larger
machines available at the time. This computer was a time-
share system, and allowed other remote sensing laboratories
to connect directly to the LARS computer via leased lines, thus
providing them with data analysis capabilities that would
have otherwise been unavailable. Several universities, NASA
centers and the USGS EROS Data Center were all connected
to the Purdue computer at various times. Sites as far away as
Australia used the system on a dial-up basis.
Eventually, LARS became very well known, both national-
ly and internationally. It was a very interdisciplinary research
team, and at its peak, there were over 100 people working at
LARS, including faculty, grad students, and research scien-
tists and engineers from 17 different departments on campus.
In addition to the remote sensing research, we offered many
short courses and had a visiting scientist program that attract-
ed researchers from all over the world. The slide and tape Re-
mote Sensing Mini-Courses and other educational materials
developed as a result of our research activities were utilized
throughout the US and the world for many years. The Inter-
national Machine Processing Symposiums held at Purdue
University for several years brought scientists and engineers
from around the world to present papers and discuss recent
developments in the processing and analysis of remote sensing
data.
The scientists and engineers at Purdue/LARS were heavily
involved in many of the major, early national remote sensing
activities. As previously mentioned, the early work by LARS
researchers allowed them to provide significant input to NASA
concerning the spectral location and number of wavelength
bands for the MSS scanner on ERTS-1 and later, the Thematic
Mapper multispectral scanner. In 1971, at the request of the
USDA and NASA, LARS coordinated the Corn Blight Watch
experiment to monitor the extent and severity of the corn
blight disease throughout a seven state area of the Corn Belt
(MacDonald et al, 1972). This experiment provided a prototype
remote sensing system in which inventory design, data acqui-
sition, processing and analysis, and information dissemination
were successfully used in a single integrated system operated
in a quasi-operational environment. The launch of ERTS-1 in
1972 initiated a new era in our research and data analysis ac-
tivities, now using satellite data. LARS researchers analyzed
the very first frame of digital ERTS-1 data obtained, and were
involved in several Landsat -1 and 2 and Skylab experiments
between 1972 and 1975. These research activities involved
several different disciplines, including agriculture, forestry,
geology, water resources and general land use applications.
Figure 13. The LARS computer facility, with the IBM 360/
Model 44 main-frame computer, line-printer, digital display
unit and tape recorders.
Figure 14. The first ever digital dis-
play unit, built at a cost of $1,000,000


