352
May 2015
PHOTOGRAMMETRIC ENGINEERING & REMOTE SENSING
2011 (Figure 2). This slower expansion of urban growth is
also reflected in the densification change rates of the imper-
viousness classes within the urban footprint—only 4.99% of
all impervious pixels increased in density from 2006 to 2011,
in contrast to 7.62% of pixels increased in density from 2001
to 2006. The reduction of urban growth from 2001–2006 to
2006–2011 may be partly attributable to the U.S. recession
that began in 2008. Although urban growth was expanding,
many newly developed areas retained (or established) tree
canopy cover. In an example of how the NLCD tree canopy
cover product can complement analysis, this product reveals
new urban areas converted to the NLCD land cover open
space developed class between 2006 and 2011 had an aver-
age tree canopy of 22.8%. Similarly, new areas of the low
intensity urban class had an average percent tree canopy
cover of 14.6% and new areas of the medium intensity urban
class had an average of 9.9%.
A formal accuracy assessment of the NLCD 2011 land cover
change product is currently underway, with interpretation of
sample points expected to be completed early in 2015. Accu-
racy protocols will analyze the decade of change information
from all three NLCD periods and will build on past methods
developed for NLCD 1992 and NLCD 2001 (Stehman et al.,
2003; Wickham et al., 2010; Wickham et al., 2013) and will
depend on independent analysis of high-resolution reference
data sources representing the historical date of the products.
NLCD 2011 for Alaska is also now available and includes
statewide products of land cover and impervious surface, as
well as land cover and impervious surface change between
2001 and 2011. A 2011 version of the tree canopy cover prod-
uct will soon be available for southeast Alaska. NLCD 2011
land cover products for Hawaii and Puerto Rico will be avail-
able later in 2015. The next generation of NLCD is under
current research and development and will be produced in
2016. Next generation research to improve accuracy, produce
additional periods of NLCD back to the mid-1980s and add
additional products will all be considered for the NLCD 2016
product suite.
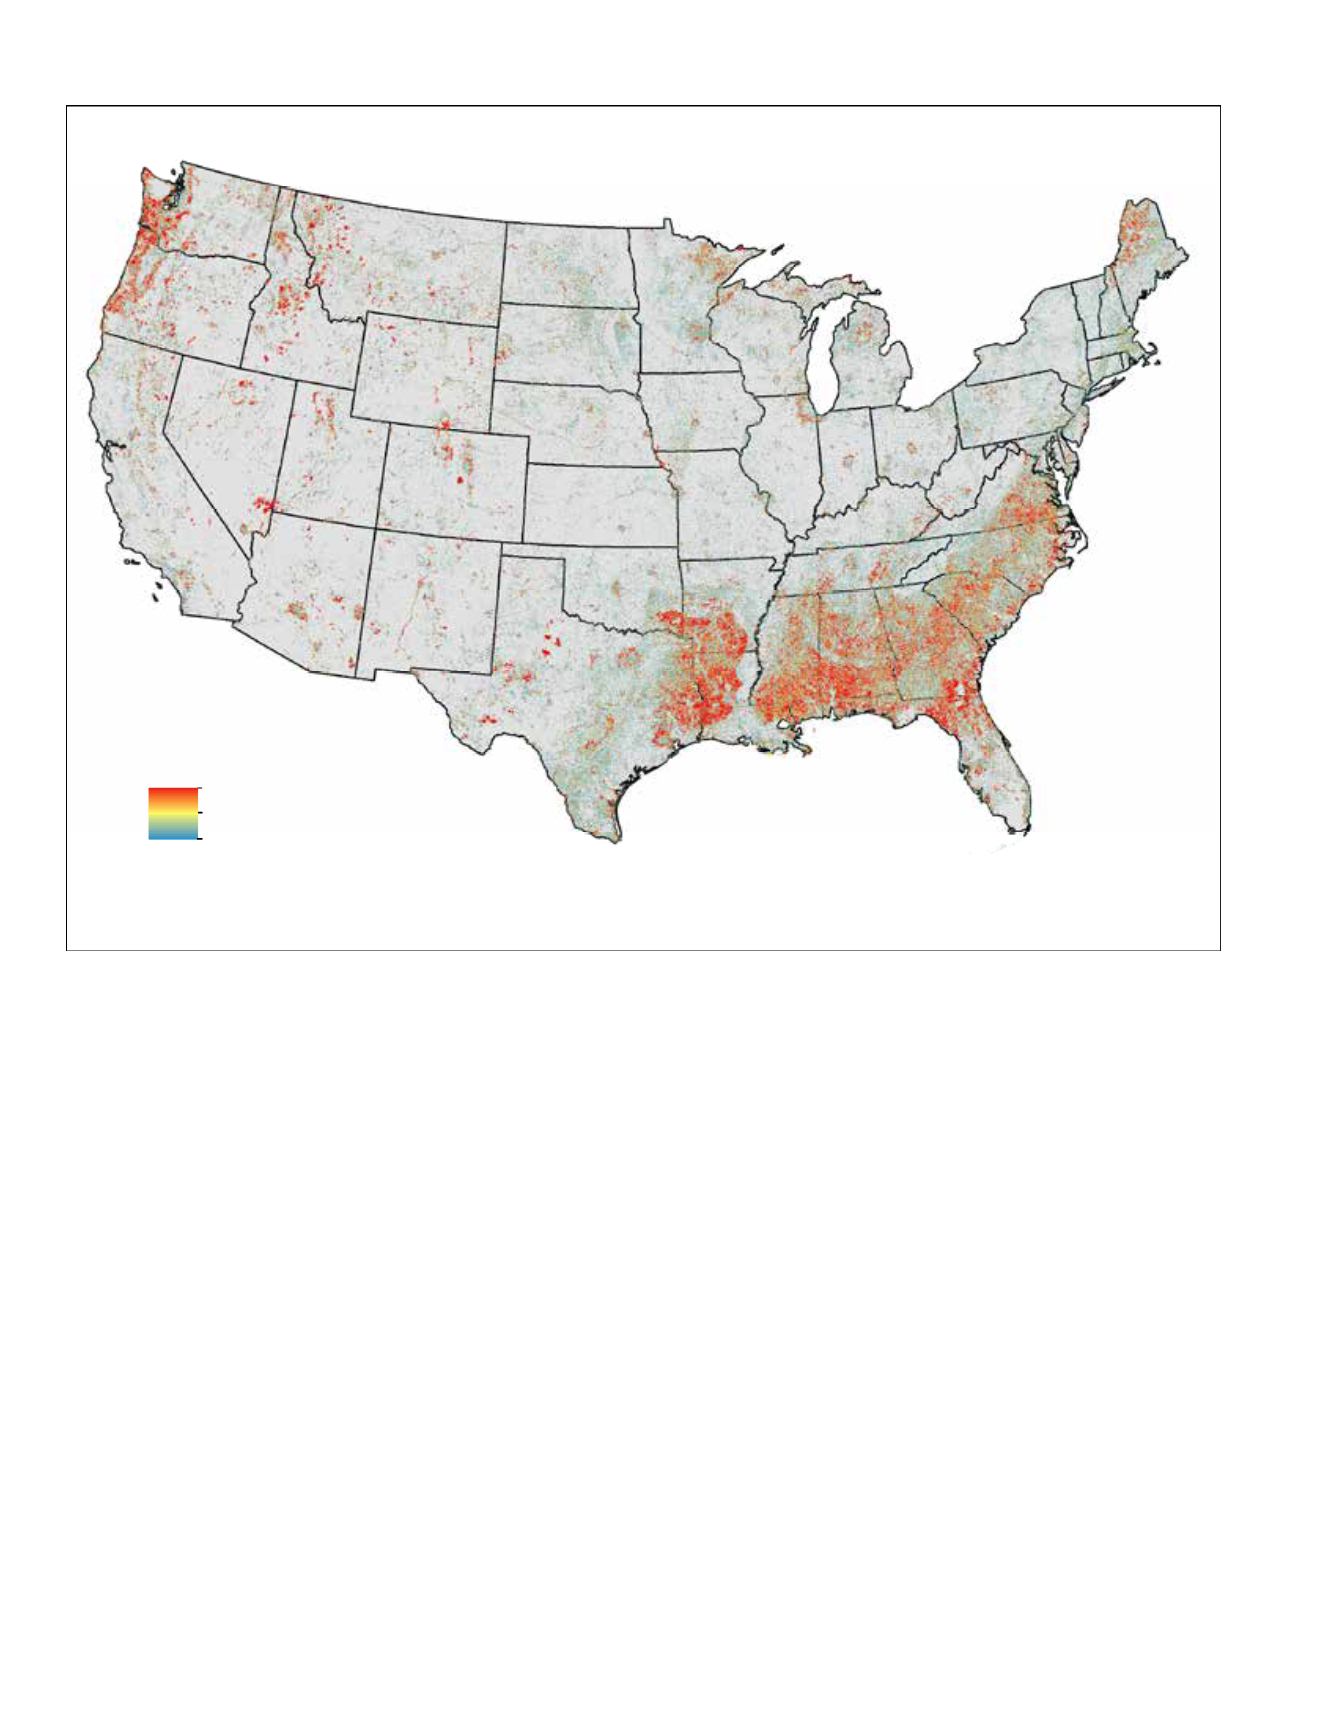
Land cover change
Low : 1%
High : 100%
Figure 3. The geospatial distribution and magnitude of land cover change in the conterminous United States between 2001 and 2011 in 1% intervals.
Change was calculated as the proportion of 30 m change pixels in a 1 km x 1 km grid. White areas represent places with no land cover change, green
tones represent areas with low proportions of land cover change, and red tones areas of high proportional change. Primary land cover change drivers
appear to be wildland fire, forest harvesting, urbanization, agricultural conversion, and forest disease.


