statistics relating to comparison results sourced from
ALS
point clouds; this is an expected artifact of the process of
interpolating the
ALS
outputs to a rasterized surface. The best
overall control is indicated in Table 3
.
Contrasting results are noted between rasterized data and
point cloud sourced data for both
GLAS
height derivations;
differences are expected based on the surface interpolation
techniques employed in rasterization, which represent a sim-
plification of the outer envelope of the point cloud distribu-
tion. Additionally, no significant difference in results is noted
for
GLAS
height derivations between all return and first return
point cloud data sources. RH
ROS
consistently outperforms
RH
100
with respect to all
ALS
heights.
Stratifications
Laser Number
Laser number filtered control comparisons for the most cor-
relating
GLAS
height method and
ALS
pXX are illustrated in
Figure 5 as a function of laser number and
ALS
data source.
Accompanying summary statistics for best correlating data
from RH
100
or RH
ROS
, and corresponding
ALS
pXX are shown
in Table 4; the best comparisons are shown per
ALS
data
source. The most representative
ALS
height is noted under the
pXX column for the best correlating
GLAS
height method as a
function of laser number and data source. Laser 3 consistently
yields best comparative results, as hypothesized and observed
in previous studies (Chen, 2010; Chen, 2010; Los
et al.
, 2012).
Raster derived
ALS
height percentiles for laser 3 correlate
best with
GLAS
canopy heights derived from RH
100
in this
case, whereas comparisons employing point cloud sourced
height percentiles correlate best with RH
ROS
derivations for all
other lasers. This former result is suspected to be somewhat
anomalous as raster derivations of
ALS
height percentiles are
subject to greater uncertainties induced by surface interpola-
tion techniques which represent a simplification of the outer
envelope of the point cloud distribution.
Phenological State
Summertime phenology (
SP
) and wintertime phenology (
WP
)
GLAS
canopy height derivations are compared with
ALS
height
percentiles for both
GLAS
height methods. The best seasonally
filtered control comparisons of the best correlating
GLAS
height
method and
ALS
pXX are illustrated in Figure 6 as a function
of data acquisition period (
SP
/
WP
) and
ALS
data source. Ac-
companying summary statistics are shown in Table 5 for the
best
GLAS
/
ALS
comparisons for both
GLAS
height methods
.
Data collected during
SP
conditions consistently exhibit
better performance over data collected during
WP
conditions,
although differences between these conditions appear more
subtle than equivalent differences noted between laser num-
ber stratification.
Transmission Energy
Comparisons of high and low laser transmission energy strati-
fied controls for the most correlating
GLAS
height method and
ALS
pXX are illustrated in Figure 7 as a function of energy
state and
ALS
data source. Accompanying summary statistics
for both
GLAS
height methods and corresponding
ALS
pXX are
shown in Table 6
.
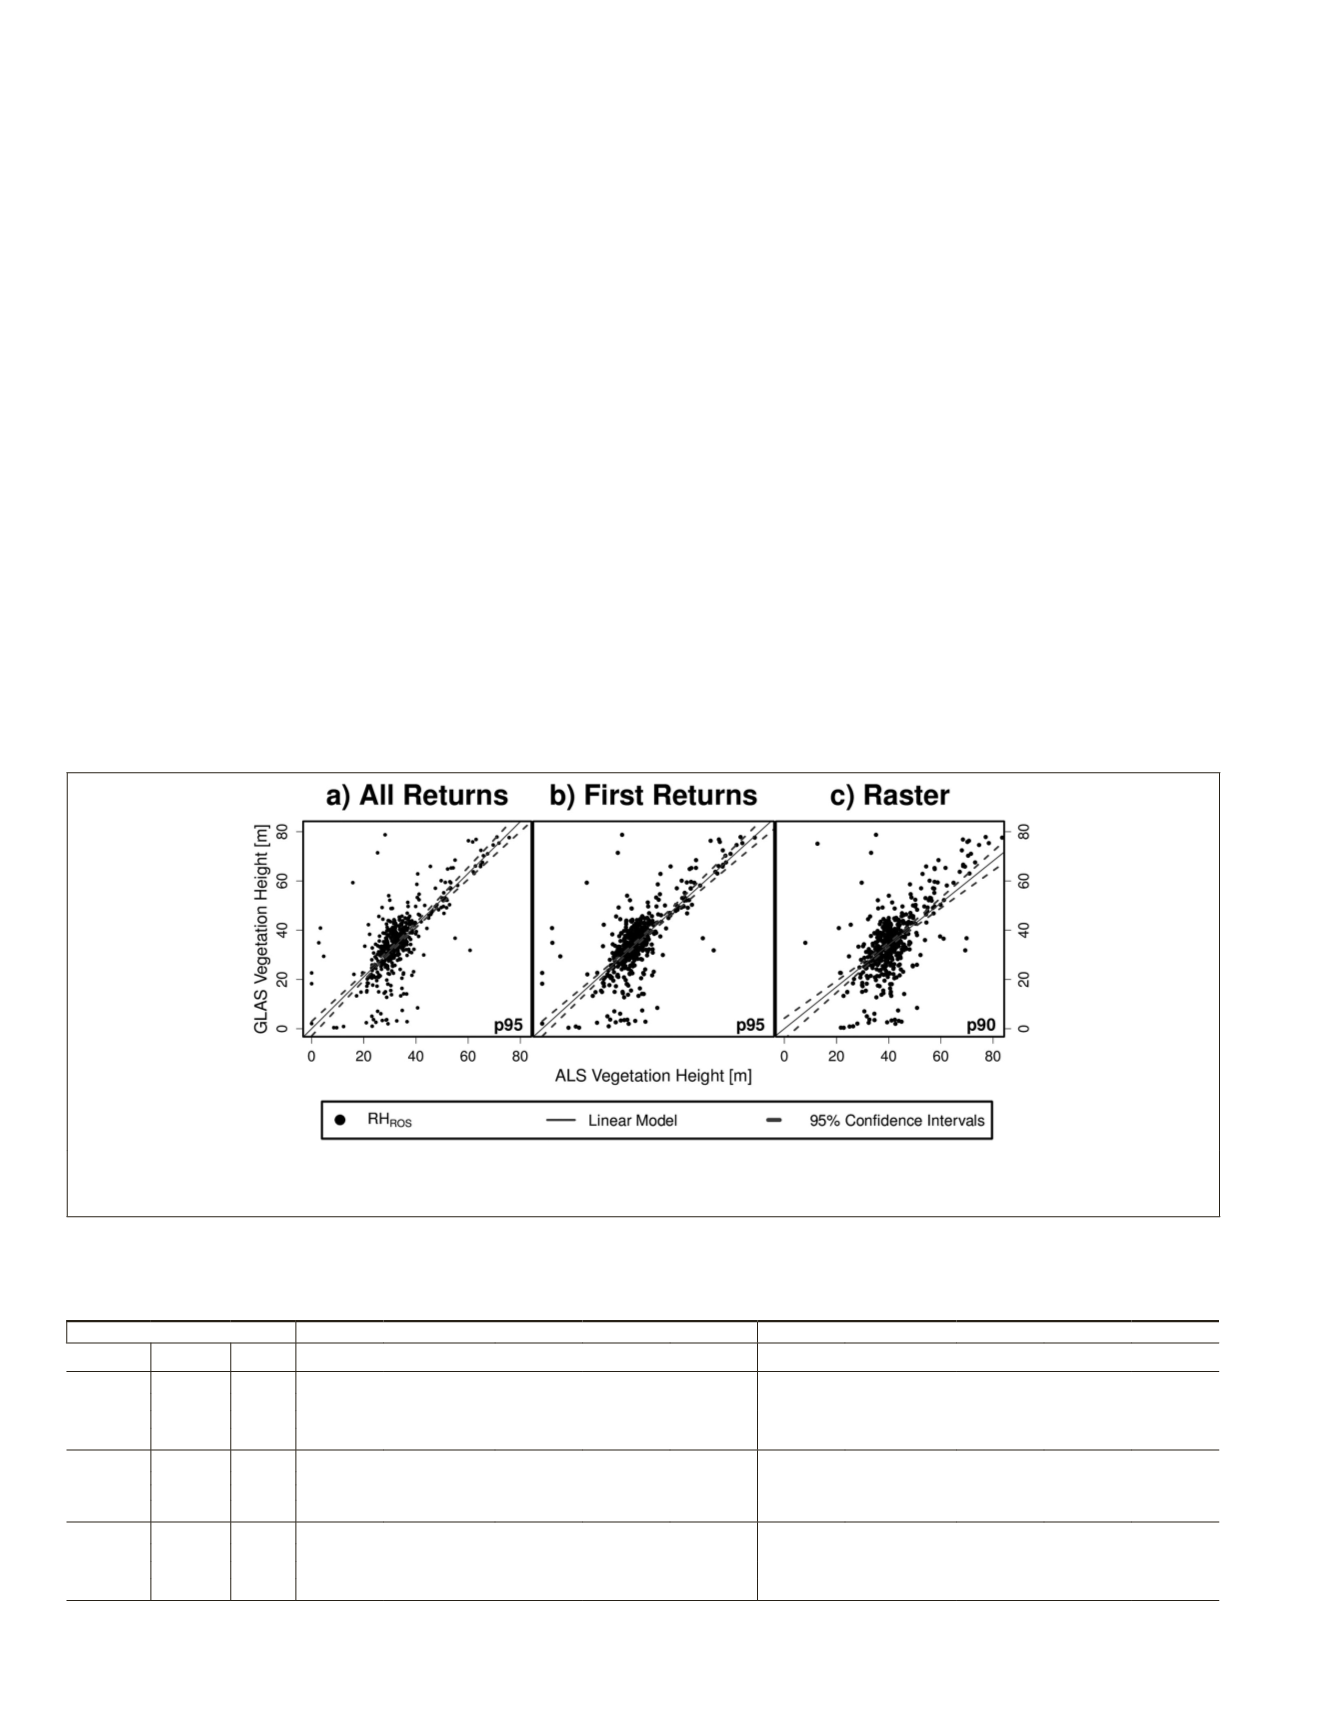
Figure 4. Comparisons of the best correlating GLAS height method and ALS canopy height percentiles across all sites per ALS data
source: (a) all return, (b) first return point clouds, and (c) raster. Linear models and associated 95 percent confidence intervals are illus-
trtaed for each comparison. All comparisons between both GLAS height methods and corresponding ALS pXX are shown in Table 3.
T
able
3. S
ummary
S
tatistics
for
C
ontrol
C
omparisons
between
ALS H
eight
P
ercentiles
(
p
XX)
and
GLAS H
eight
M
ethods
(RH
100
& RH
ROS
)
for
each
D
ata
S
ource
. T
he
best
GLAS R
epresentation
of
ALS
p
XX
are
B
old
for
E
ach
ALS D
ata
S
ource
; RH
ROS
O
ffers
B
est
C
orrelation
in
A
ll
C
ases
. N
ote
: N = S
ample
S
ize
,
= G
radient
of
F
itted
L
inear
M
odel
, RMSE = R
oot
M
ean
S
quared
E
rror
, R
2
= C
oefficient
of
D
etermination
, F
20
= F
raction
of
P
redictions
W
ithin
20
P
ercent
of
O
bservations
,
and
F
B
=
fractional
bias
.
RH
100
RH
ROS
Data pXX N
RMSE
R
2
F
20
|F
B
|
RMSE
R
2
F
20
|F
B
|
Raster
p90
486
0.99
13.13
0.32
0.89
0.01
0.85
12.14
0.41
0.90
0.16
p95
0.99
13.15
0.32
0.89
0.01
0.85
12.27
0.40
0.90
0.17
p99
0.98
13.29
0.31
0.89
0.02
0.84
12.60
0.39
0.89
0.18
p100
0.97
13.49
0.29
0.89
0.03
0.83
13.00
0.36
0.89
0.19
All
p90
480
1.34
16.57
0.35
0.63
0.32
1.16
10.73
0.49
0.84
0.16
p95
1.22
14.51
0.38
0.78
0.21
1.05
9.55
0.51
0.90
0.06
p99
1.08
12.89
0.38
0.87
0.08
0.93
9.94
0.49
0.91
0.07
p100
0.97
13.09
0.32
0.89
0.03
0.83
12.54
0.41
0.89
0.18
First
p90
480
1.27
15.41
0.36
0.72
0.26
1.10
9.93
0.51
0.88
0.11
p95
1.17
13.84
0.39
0.81
0.17
1.01
9.37
0.51
0.90
0.02
p99
1.06
12.74
0.37
0.88
0.06
0.92
10.18
0.48
0.91
0.09
p100
0.97
13.09
0.32
0.89
0.03
0.83
12.54
0.41
0.89
0.18
356
May 2016
PHOTOGRAMMETRIC ENGINEERING & REMOTE SENSING


