were conducted for three study sites across Australia, where
ecosystem diversity is high across the country. However, the
ecosystem diversity encapsulated by this study was limited
by the number of
TERN
sites that exhibited
GLAS
/
ALS
coinci-
dence. Additionally, wider restrictions such as the inability to
investigate specific land cover types (e.g., persisting wetlands,
snow cover etc.), were not possible with available data
.
Instrument parameter investigations support previous find-
ings that laser 3 is the most consistent of the
GLAS
lasers for
canopy height retrieval (Simard
et al.,
2011; Los
et al.
, 2012).
This is advocated by the findings of Abshire
et al.
(2005),
where energy decay for laser 3 was found to be least severe.
Laser 1 decayed rapidly and hence provided little energy sta-
bility; laser 2 decayed at a reduced rate but current findings
suggest that its rate of energy decay was sufficient to effect
height derivations. Previous studies indicate a general prefer-
ence in the community for Laser 3 data over other campaigns,
but few provide a detailed rationale for this choice (Rosette
et
al.
, 2008; Chen, 2010; Chen, 2010; Rosette
et al.
, 2010; Simard
et al.
, 2011; Wang
et al.
, 2014). However, here we present a
rigorous empirical justification for this choice.
In addition,
GLAS
data collected during summertime
phenological (
SP
) conditions were found to promote the
retrieval of more representative canopy heights (with respect
to
ALS
data), over observations collected during wintertime
phenological (
WP
) conditions. This is because the vegetated
area intersected by incident laser radiation is at its maximum
during
SP
conditions. Insufficient reflectance from intersected
canopy tops fail to trigger the detector’s internal intensity
threshold for the registration of an encountered object. For
vegetation this means the tallest canopy elements are not
observed (Hopkinson, 2007; Lefsky
et al.
, 2007; Yang
et al.
,
2011), resulting in systematically under-estimated canopy
heights. However, for increased foliage/leaf area index (
LAI
),
incident laser radiation penetrating the canopy to the ground
is reduced (Rosette
et al.
, 2013), hence introducing uncertain-
ty in the height of the ground response, thus, in extreme con-
ditions, reducing the confidence in retrieved canopy heights
.
Furthermore, laser transmissions with higher energies have
been found to yield more representative canopy heights with
respect to
ALS
data. Laser energy is related to the amount of
energy reflected from a target, which is a function of inter-
sected target area and optical properties (Baltsavias, 1999).
Hence for reduced laser energies, a greater area of intersection
is required to produce the same return amplitude as would
be observed from the same object if illuminated with a higher
energy laser. Additionally, transmitted pulse energy decays in
transit to and from the illuminated target (Svelto, 2010), there-
fore higher initial transmit energies are more likely to return
higher energies at the detector. More energetic returns (within
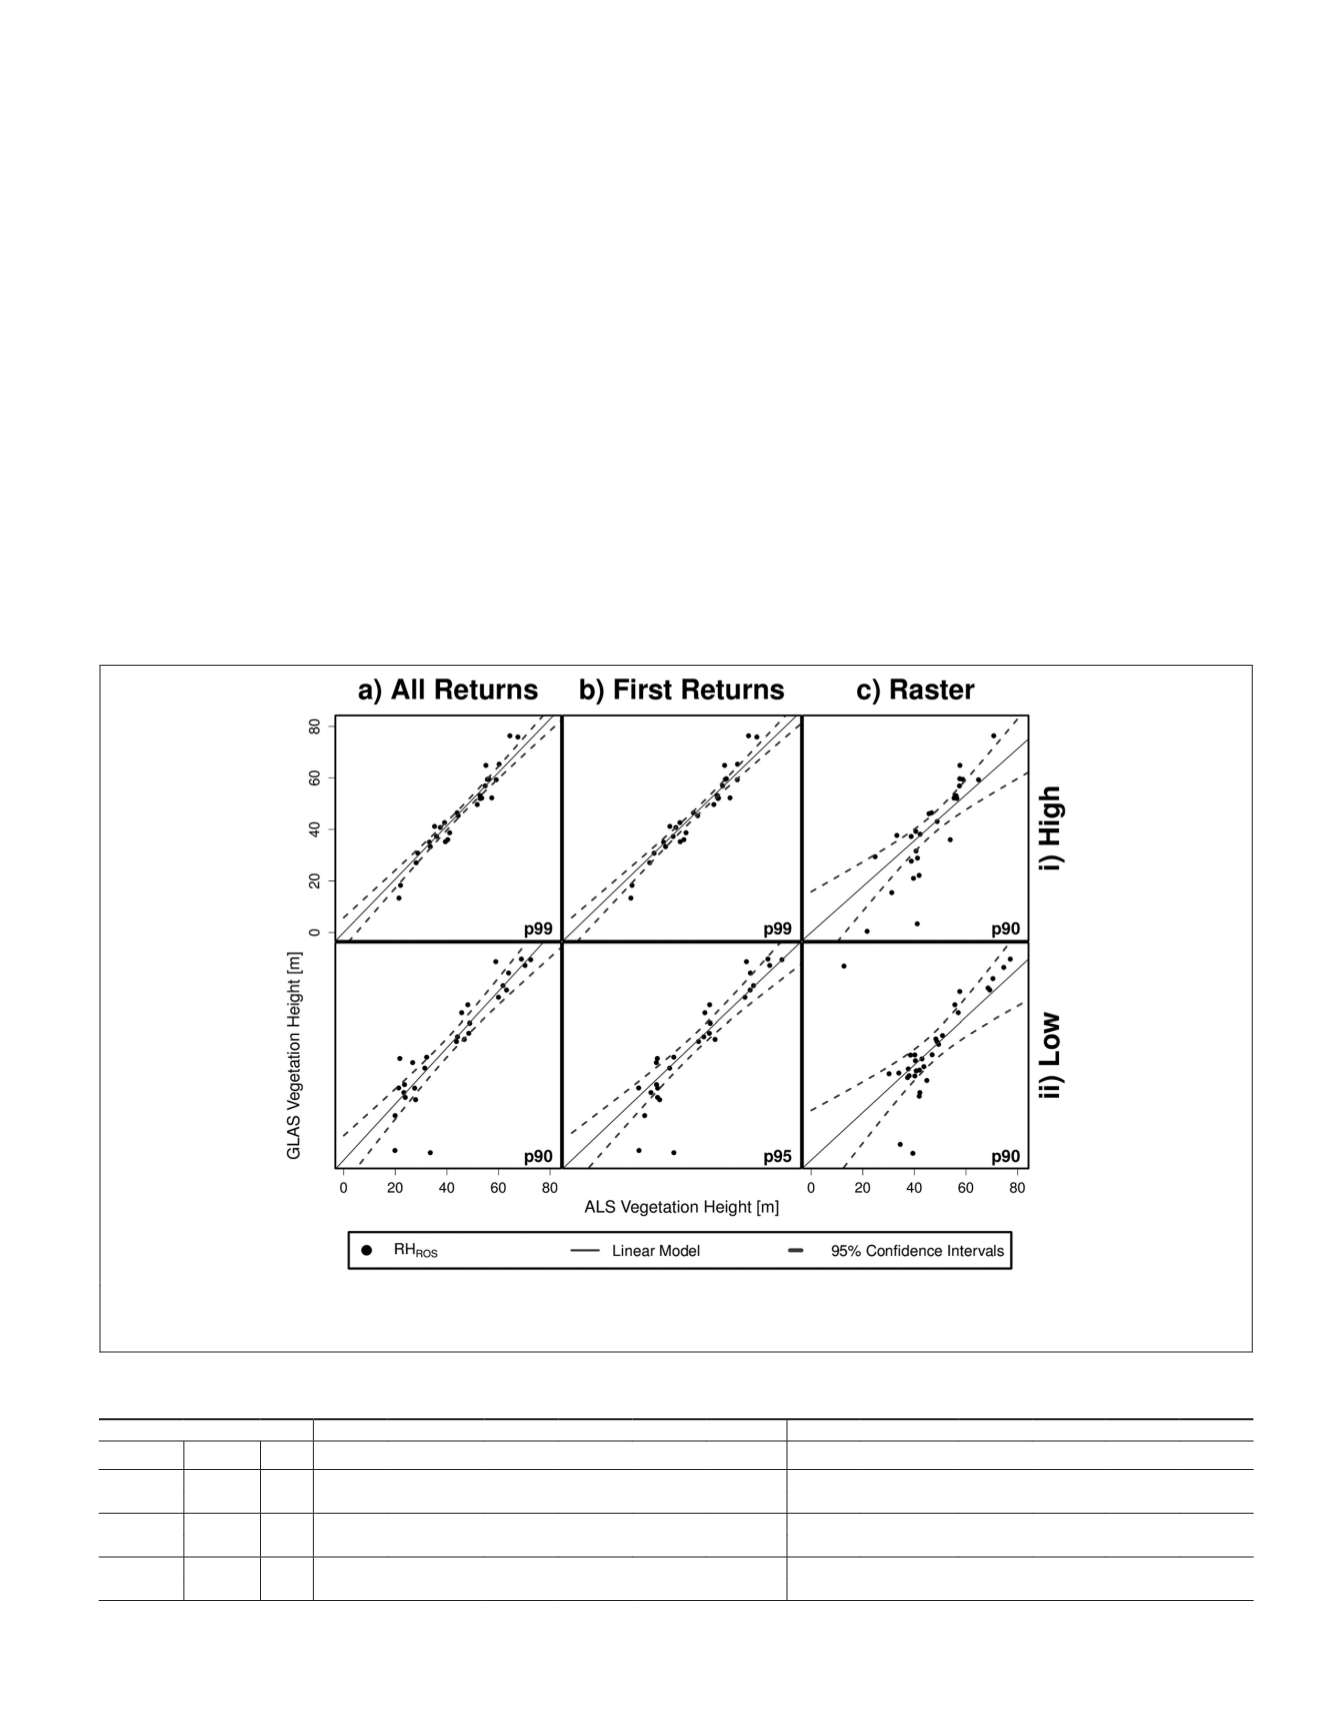
Figure 7. Stratified control comparisons for the best GLAS height method and ALS pXX as a function of ALS data source: (a) all returns, (b)
first returns, and (c) raster; and each laser energy state: i) high energy (>28 mJ), and ii) low energy (≤28 mJ). Linear models and associ-
ated 95 percent confidence intervals are also illustrated.
T
able
6. S
ummary
S
tatistics
for
C
ontrols when
F
iltered
A
ccording
to
GLAS L
aser
T
ransmission
E
nergy
(H
igh
/L
ow
);
p
XX
is
the
M
ost
C
losely
R
elating
ALS H
eight
P
ercentile with
E
ach
GLAS H
eight
D
erivation
;
the
B
est
R
elating
GLAS/ALS C
omparisons
are
B
old
for
E
ach
ALS D
ata
S
ource
. N
ote
: E
n
R
efers
to
L
aser
E
nergy
S
tate
.
RH
100
RH
ROS
Data
En N
RMSE R
2
F
20
F
B
pXX
RMSE R
2
F
20
F
B
pXX
Raster
High
60
1.00 16.34 0.46 0.20 0.02 p90
0.89 11.64 0.65 0.30 0.15 p90
Low
1.01 16.18 0.32 0.42 0.02 p100 0.92 15.05 0.36 0.43 0.07 p90
All
High
60
1.06 12.87 0.58 0.35 0.05 p100
1.04
4.45
0.92 0.47 0.02 p99
Low
1.10 14.24 0.72 0.27 0.06 p95 1.09
9.00
0.82 0.30 0.02 p90
First
High
60
1.06 12.87 0.58 0.35 0.05 p100
1.02
4.28
0.92 0.47 0.01 p99
Low
1.07 13.98 0.71 0.28 0.03 p95 1.00
9.06
0.81 0.35 0.01 p95
PHOTOGRAMMETRIC ENGINEERING & REMOTE SENSING
May 2016
359


