To conclude ‘A/E50’ objective function produces a consistent,
optimal solution by minimizing errors and selecting well-
distributed
GCP
s. It is also found to be resistant to 50 percent
of errors in the data and
GA
converges to solution mostly
between 20 generations and 40 generations even with errors
in the data sets.
Comparison between GA, RANSAC and Iterative LSQ
The same experiment previously done is compared with
non-
GA
based methods implemented in
RANSAC
and itera-
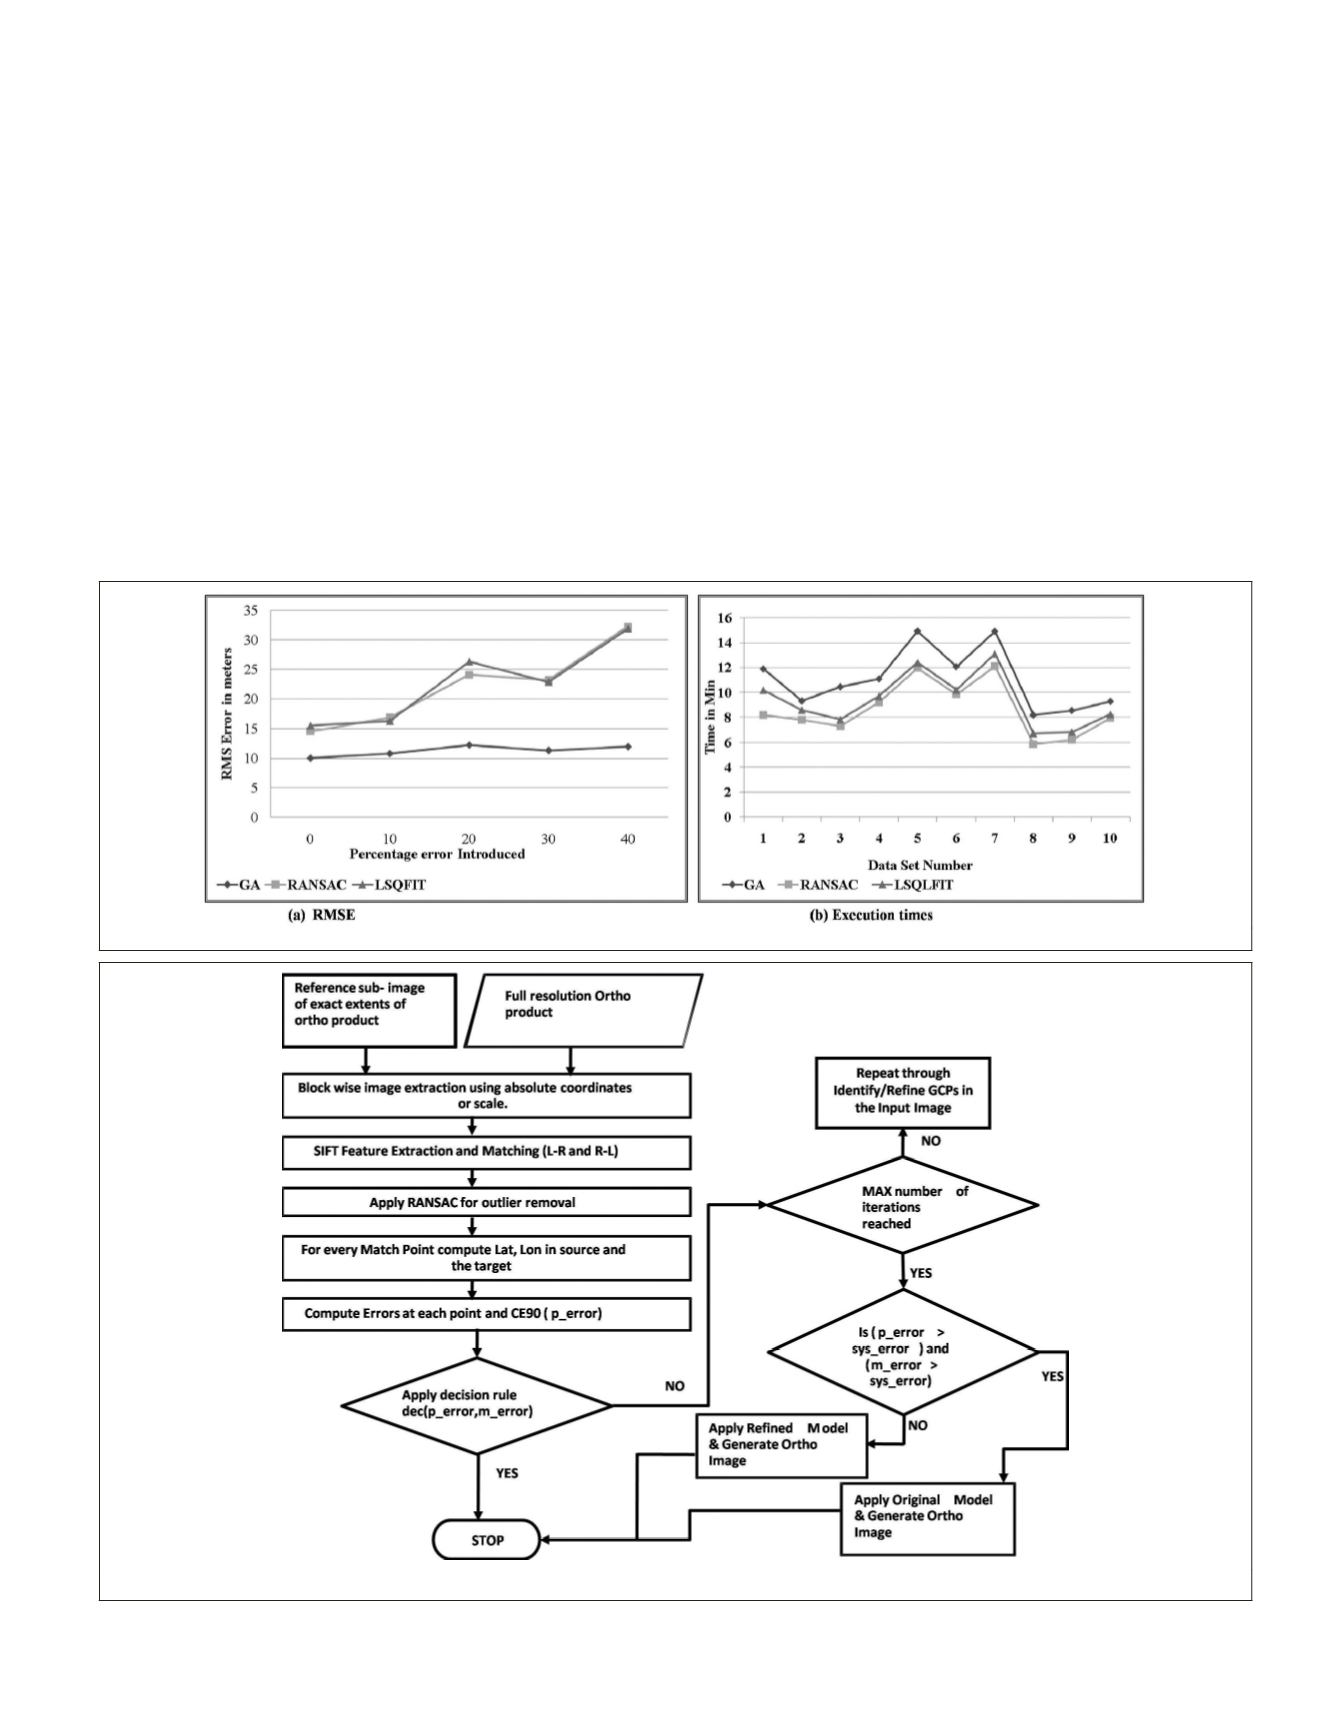
tive LSQ Fit; the results are depicted in Figure 6. Figure 6a
indicates that even as the percentage of errors increased, the
GA
produced consistent results by generating an accurate
ortho-product as compared to other methods. The product er-
rors were found to be around 10 m with proposed
GA
method-
ology, while
RANSAC
and Iterative LSQ Fit failed to generate
accurate ortho-products; the error increasing to as high as 35
m in the final product when 40 percent of points were errone-
ous. Figure 6b depicts the running times of
GA
,
RANSAC
, and
Iterative LSQ. It is well known that evolutionary methods
take more time compared to deterministic and heuristic based
approaches. It was observed that
GA
took two to four minutes
more compared to the other approaches. We believe that this
additional time used may be easily compromised as the final
product generated is assured of better accuracy.
The conclusion of this experiment is that with a fractional
increase in time taken, the proposed
GA
method produces an
accurate product as compared to
RANSAC
and Iterative LSQ fit.
Decision Rule-based Product Evaluation
After the successful evaluation of
RSM
using the
GCP
s identi-
fied by
GA
, the ortho-product is generated automatically using
the standard ortho-rectification procedure as shown in block
$
in Figure 1. The proposed methodology of product evaluation
is depicted in Figure 7. It also describes the control loop back
structure for re-generating the product if error in the product
is more than the acceptable limits.
Product evaluation involves identifying tie points in both
the reference image and the ortho-image. To identify the tie
points, we again propose
SIFT
-based feature matching, as was
previously done in the “checkpoint identification section.”
Here, the first stage of transformation estimation is by-passed
Figure 6. Comparison of proposed GA method with RANSAC and Iterative LQS Fit for RSM refinement.
Figure 7. Product evaluation and Control Loop back mechanism.
PHOTOGRAMMETRIC ENGINEERING & REMOTE SENSING
May 2016
383


