PHOTOGRAMMETRIC ENGINEERING & REMOTE SENSING
June 2018
335
Results
To compare results from the drone aerial photog-
raphy approach, the Ragan-Smith reality capture
specialist calculated volumes using the lidar scan-
ner technique.
Lidar v UAV volume test procedures: mapping a
pile of rock with spot elevation and comparing vol-
umes between the data derived from the UAS im-
agery and that collected with a Leica Geosystems
ScanStation C10. Results are shown in Table below.
As predicted, due to the “cratered” top surfaces
that the lidar overestimates, the UAV calculations
produce smaller volumes for both piles.
Conclusion
From the assessment of the reality capture spe-
cialist on the project, point clouds derived from
UAV photogrammetric techniques produced more
accurate models and therefore more precise stock-
pile calculations than terrestrial lidar scanning
techniques. Both UAV and lidar methods offer
improvements and efficiencies over traditional
manual approaches by saving time, being safer,
and reducing site downtime and disruption. The
UAV approach took even less time than the lidar
scan approach. This means less downtime and lost
production on the working site by using the UAV
techniques.
GEO Jobe has been conducting drone based aerial
photography missions to capture data and create
accurate high resolution digital mapping products
for over two years. We provide GIS users with
small area orthophoto updates; surveyors with 3D
point clouds for design purposes; and engineers
with digital terrain model CAD files. For this task
we used Pix4D software for the photogrammetric
processing and point cloud generation. This is an
ideal solution with robust features and functions
that enables our crew to consistently create accu-
rate, high resolution, digital mapping products -
something our clients have come to expect.
Visual and interactive
content
Link to 3D model Sketchfab
Volumes calculated by terrestrial lidar and UAV photogrammetry and their difference.
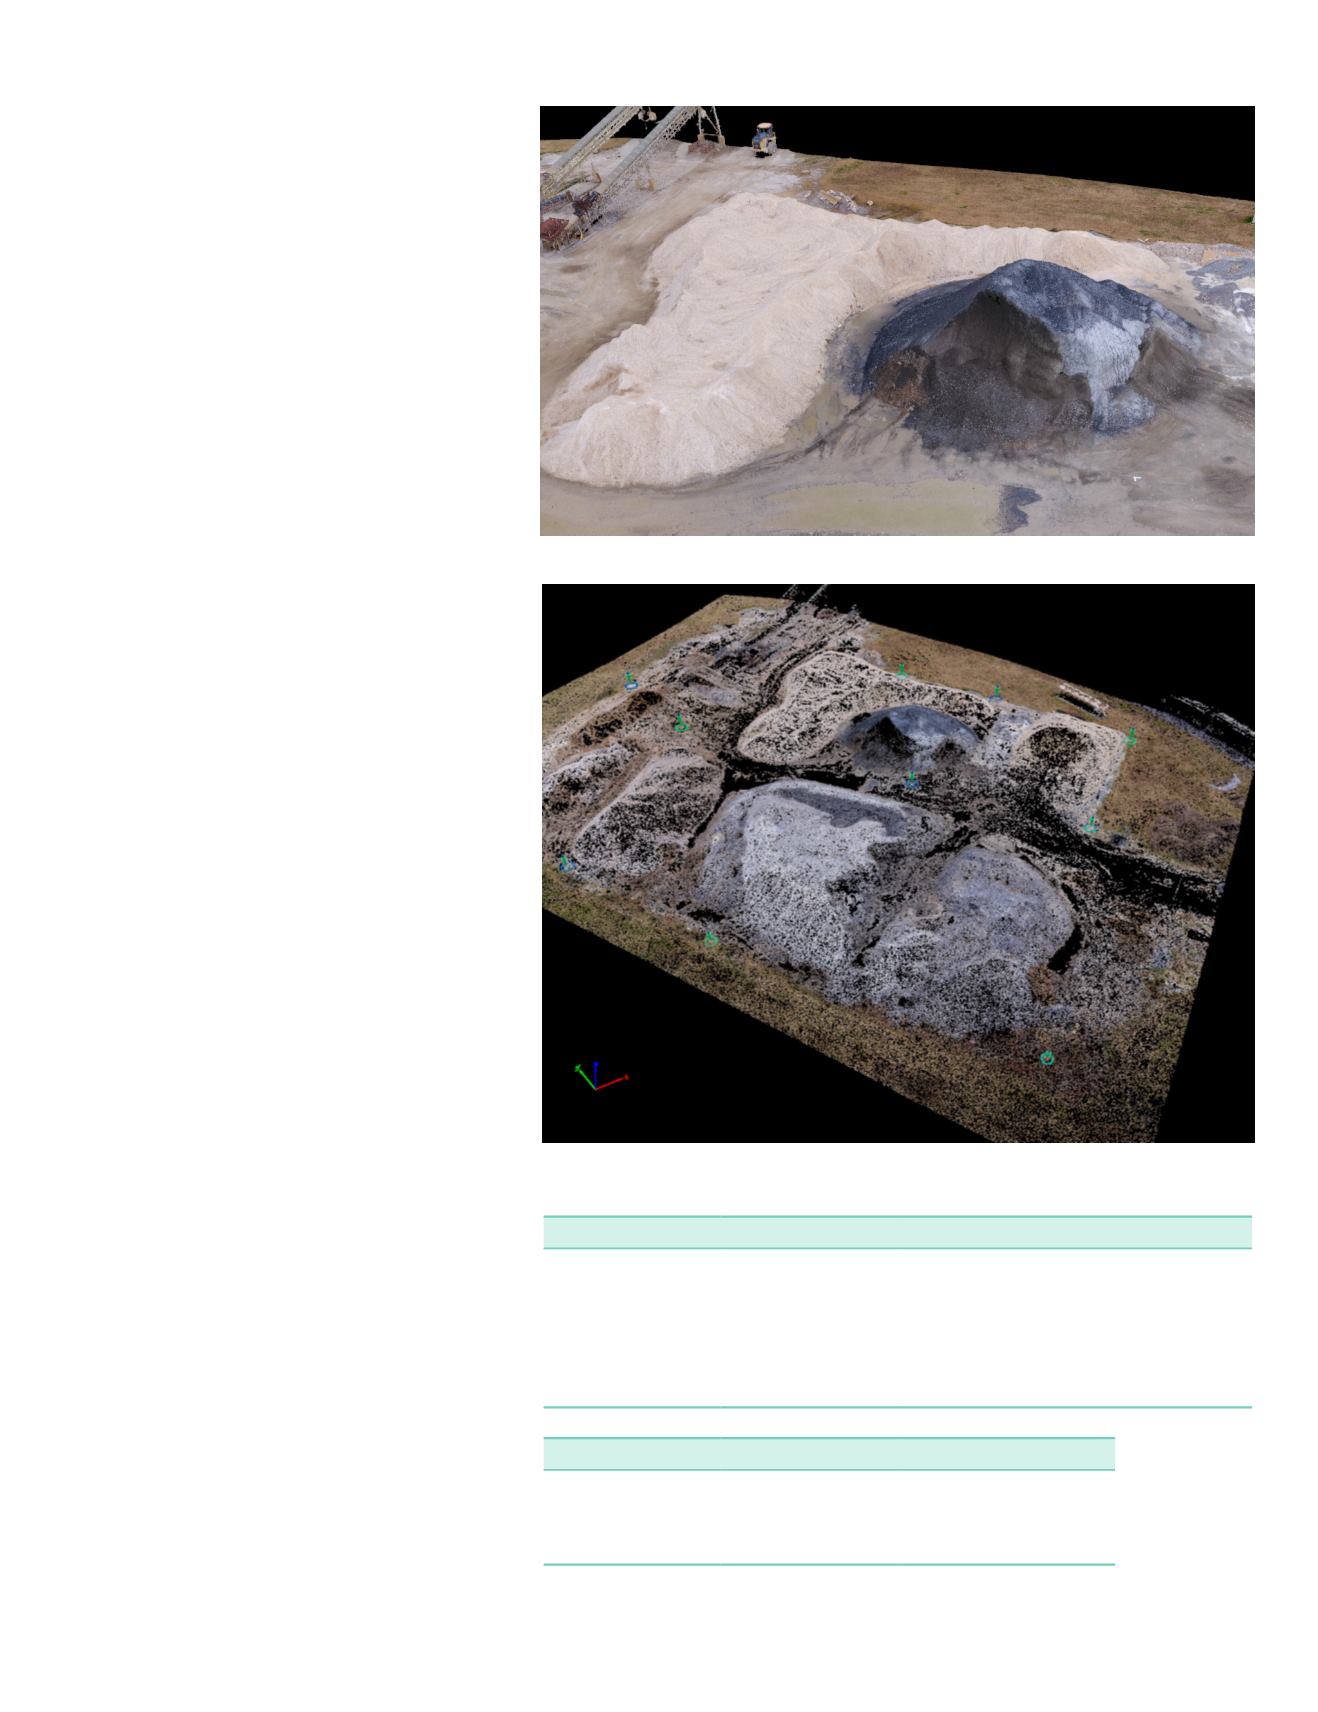
3D Point Cloud from UAV.
Automated tie points from UAV images.
Volumes Comparison
Product
Cut Volume (ft
3
)
Fill Volume (ft
3
)
Total Volume (ft
3
)
White Pile UAV
96.9
68187.36
68090.46
White Pile C10
38.46
70344.06
70305.6
Black Pile UAV
2.1
43437.47
43435.37
Black Pile C10
0
44099.88
44099.88
UAV vs. C10 (ft
3
)
UAV vs. C10 (%) UAV vs. C10 (ft
3
per ft
2
)
Δ
Δ
Δ
–2215.14
3.20%
–0.161
–664.51
1.51%
–0.117


