these check points whose 3D spatial coordinates were known
from the total station. The absolute discrepancy was calcu-
lated from the coordinate difference between the videogram-
metric system and the total station, which is shown in Table
4. The RMS values are 0.443 mm, 0.556 mm, and 0.451 mm
in the X, Y and Z directions, respectively. To obtain the rela-
tive discrepancy, each two points were chosen from 10 check
points, and the deviations of the relative coordinate difference
of these two points between the videogrammetric system and
the total station were calculated. In total, 45 pairs of relative
coordinate differences can be found for each direction, and
the RMS value is 0.489 mm in the X direction, 0.648 mm in
the Y direction, and 0.553 mm in the Z direction. In addition,
the inner accuracy of the videogrammetric measurement (i.e.,
adjustment accuracy) can be estimated from the process of
bundle adjustment, and is 0.221 mm, 0.539 mm, and 0.213
mm in the three directions, respectively. It is worth noting that
the absolute discrepancy, relative discrepancy, and inner accu-
racy of the videogrammetric measurement in the three direc-
tions are all less than 1 mm. The accuracy in the Y direction,
which is the depth direction in photogrammetry, is the worst.
The stability of the relationship between the cameras and
control points is crucial to the videogrammetric measurement.
An additional test was therefore implemented to investigate
this issue, in which the control points were tracked and po-
sitioned throughout the image sequence. Two control points
and a checkpoint were randomly chosen in different regions
and processed through the videogrammetric system. The mea-
sured spatial coordinate time histories of the control points
nearly remain unchanged, and the maximum variations are
all less than 0.25 mm, which indicates that the cameras and
control points were not obviously affected by the induced vi-
brations from the shaking table, and verifies the effectiveness
of the videogrammetric measurement.
Table 4. Coordinate Differences of the Check Points between
the Videogrammetric System and the Total Station (Unit: mm).
No.
Coordinate difference
X
Y
Z
C2
0.018
0.309
−0.161
C4
−0.583
0.229
0.467
C7
−0.055
0.638
−0.15
C10
0.28
−0.109
0.041
C12
−0.421
−0.903
0.133
C15
−0.469
0.121
−0.96
C18
−0.893
−0.217
0.461
C19
−0.118
0.687
0.761
C22
−0.565
0.766
−0.162
C25
−0.101
−0.768
0.108
RMS
0.443
0.556
0.451
Comparison with the Original Seismic Waveform
As the test box is a rigid body on the shaking table, the mea-
sured acceleration of reference points on the test box should
be theoretically the same as the input seismic waveform. The
Y-direction and Z-direction acceleration of the reference points
should be 0 in this case. Therefore, a comparison between the
videogrammetric acceleration and the original seismic wave-
form was carried out to validate the performance. In addition,
the effect of the Savitzky-Golay filter used in this paper was
evaluated with the acceleration of the reference points.
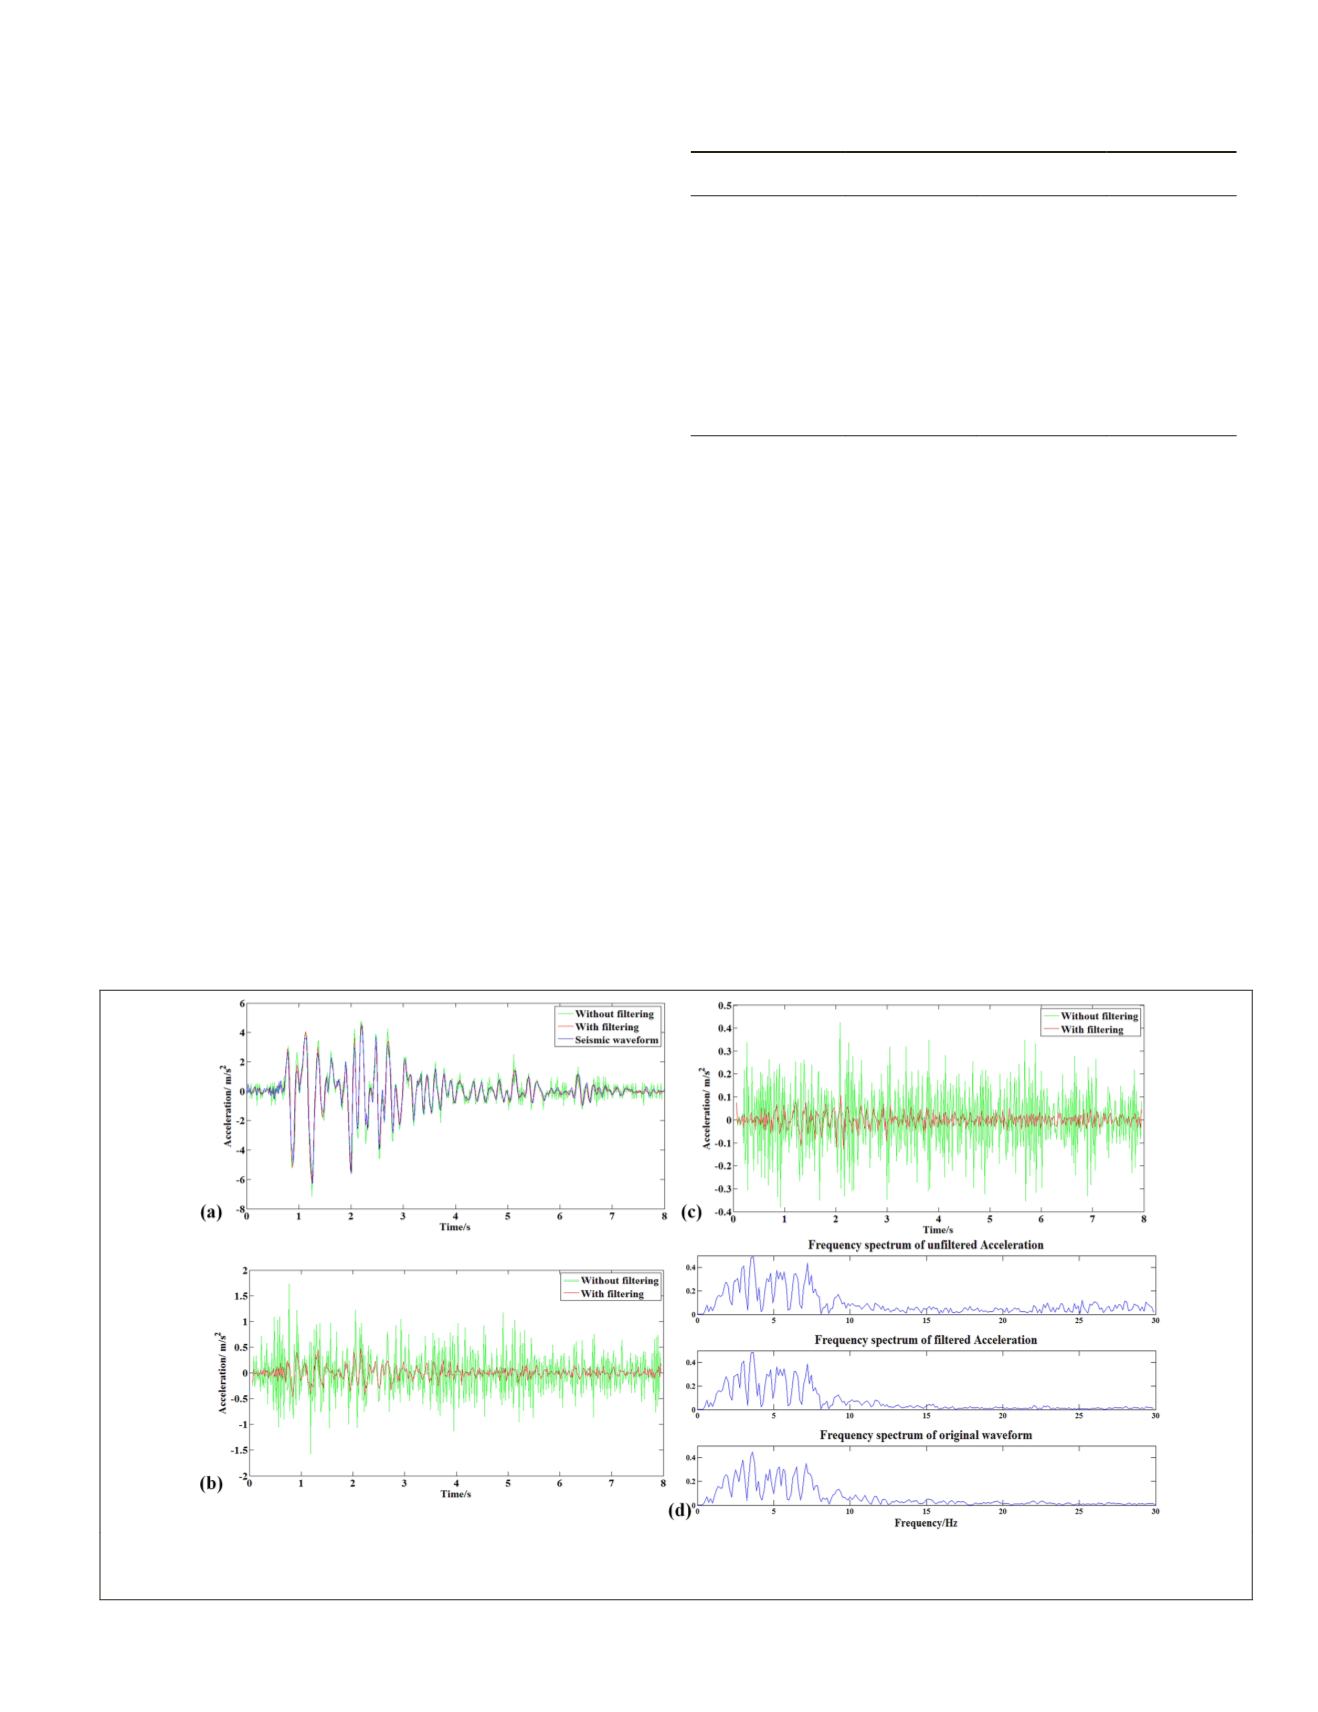
Figure 7a, 7b, and 7c show the measured accelerations
of reference point R1 with and without filtering in the X, Y,
and Z directions, respectively. The input Kobe wave in the X
direction is also plotted in Figure 7a. Figure 7d presents the
frequency spectrum of the filtered and unfiltered acceleration
and original waveform in the X direction. From Figure 7a, it
can be seen that the X-direction acceleration of R1 with the
smoothing filter coincides well with the input Kobe wave in
the dominant vibration direction, which indicates the reliabil-
ity of the videogrammetric measurement. On the other hand,
the Savitzky-Golay filter is effective in maintaining the main
tendency, while also reducing random noise possibly result-
ing from input noise and measurement error. The effect of the
Figure 7. (a) The acceleration of reference point R1 with and without filtering and the input Kobe wave in the X direction,
(b and c) The acceleration of reference point R1 with and without filtering in the Y and Z directions, and (d) The frequency
spectrum of the filtered and unfiltered acceleration and original waveform in the X direction.
PHOTOGRAMMETRIC ENGINEERING & REMOTE SENSING
September 2018
589


