noise reduction is especially obvious in the case of small mag-
nitudes. In the Y and Z directions, as well as the beginning
and end of the X direction, the filtered accelerations are closer
to the true value. Moreover, several inaccurate peak values are
suppressed to accord with the input waveform. For instance,
the maximum absolute value of the acceleration data without
filtering is 7.1560 m/s
2
, while the maximum absolute value
of the filtered acceleration is 6.2418 m/s
2
, which approaches
the maximum absolute value of the Kobe waveform, namely
0.63 g. Through the frequency analysis, it can be seen that
the Savitzky-Golay filter mainly works in the high-frequency
region, in which the high-frequency noise is eliminated.
Comparison with Acceleration Sensors
For the purpose of further validating the videogrammetric
system, the acceleration directly measured using two horizon-
tal-direction acceleration sensors was compared with the vid-
eogrammetric X-direction acceleration of two tracking points
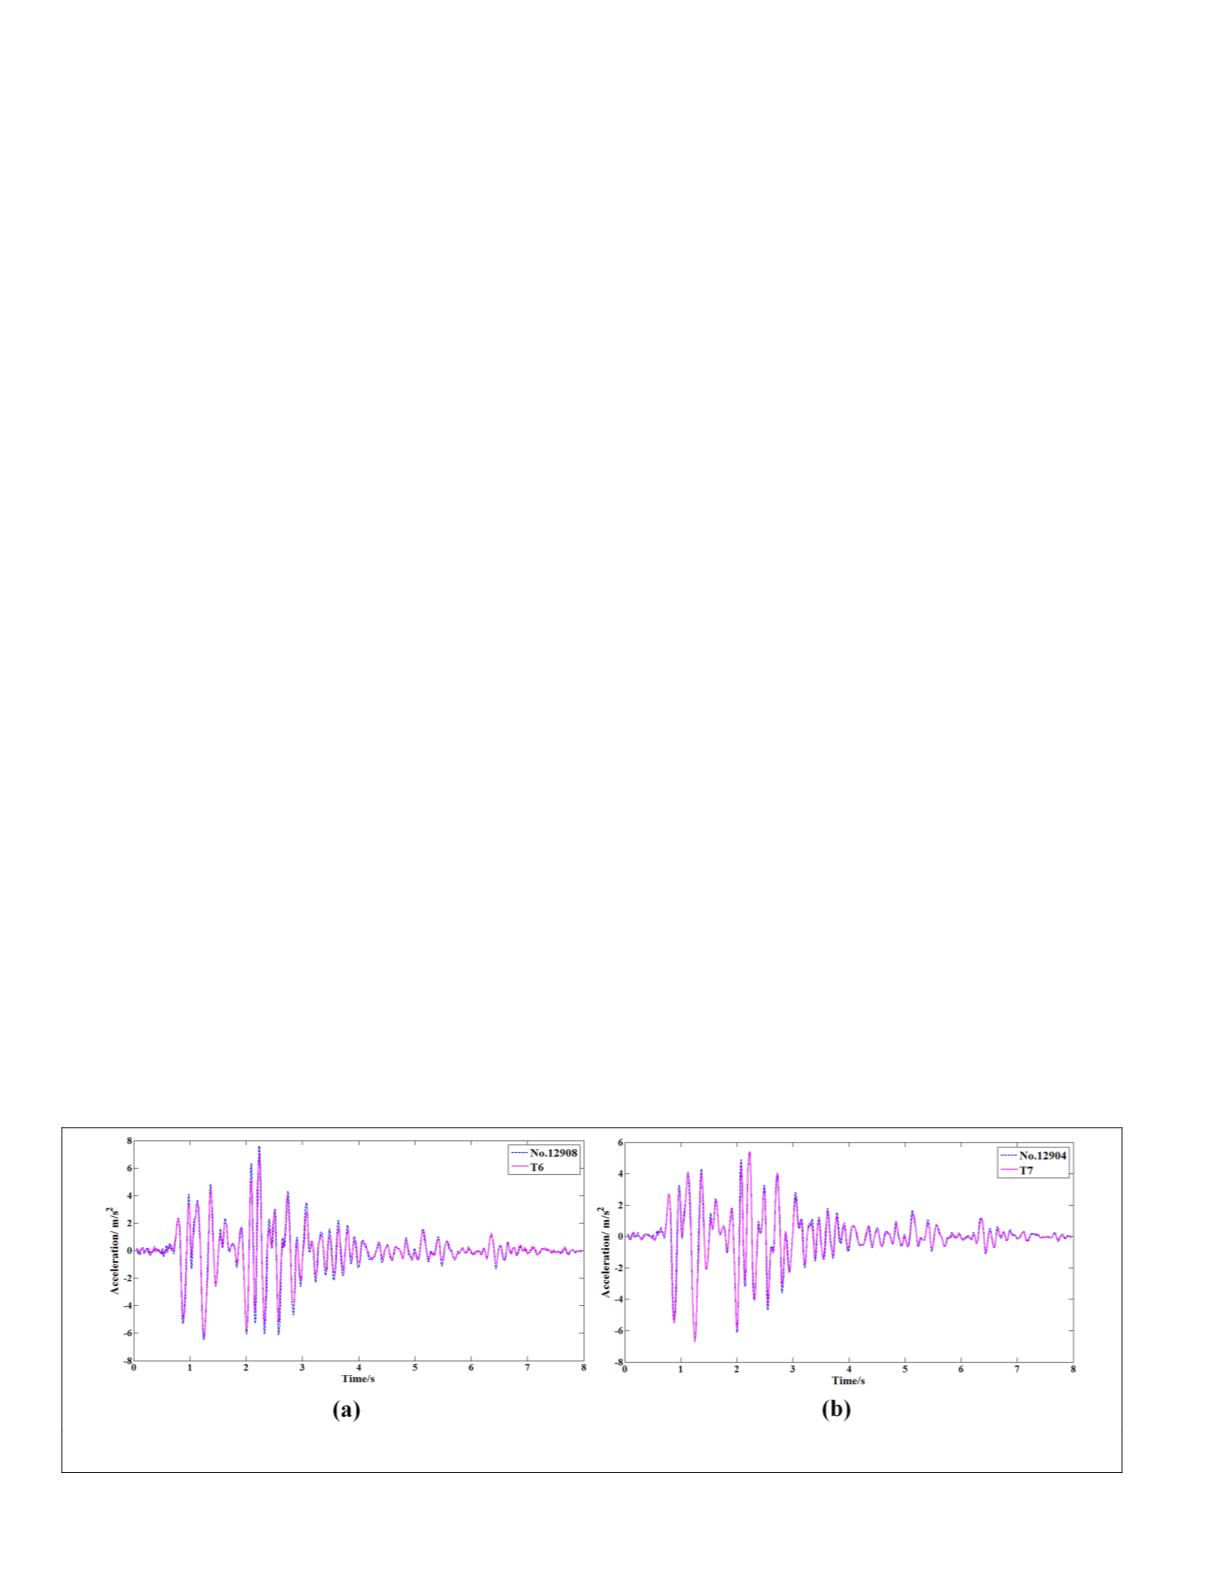
at nearby positions. Specifically, T6 was compared to acceler-
ation sensor no. 12908, and T7 was compared to acceleration
sensor no. 12904 (see Figure 3 and Figure 4). The acceleration
measured by the accelerometer was also pre-smoothed using a
Savitzky-Golay filter to reduce the measurement noise. Figure
8 shows the comparison between the acceleration time histo-
ries obtained from the two ways. In both cases, a close match
between the videogrammetric and the directly measured ac-
celeration can be seen, although the former seems to under-
estimate the latter at some local extrema. The reason for this
magnitude deviation might arise from two aspects. On the one
hand, the positions of the acceleration sensors and the track-
ing points had a slight difference. The tracking targets were
fixed on the surface of the dam model, while the acceleration
sensors were buried within the dam model, for operational
limitation. On the other hand, the sampling frequency of the
cameras was not high enough, as the frame rate was 60 fps
while the sampling frequency of the acceleration sensors was
128 Hz. In order to quantitatively compare the two measured
results, the acceleration measured by the accelerometer was
resampled to the same frequency as the videogrammetric
acceleration. The RMS value of the difference between no.
12908 and T6 is 0.373 m/s
2
, and their correlation coefficient
is 0.952. The RMS value of the difference between no. 12904
and T7 is 0.328 m/s
2
, and their correlation coefficient is 0.978.
The results of the quantitative comparison are acceptable as
these difference values still include other errors, such as the
bias from the simple registration of the two data sources ac-
cording to the sampling time.
Conclusions
In this paper, an improved subpixel phase correlation method
is proposed. The improvement on robustness and reliability is
attributed to inheriting the advantages of the original Stone’s
method as well as integrating with gradient representation,
HMSS
robust estimation and robust iteration. Based on the
improved phase correlation method associated with
ELSDc
ellipse detector, non-rigid point set registration and other
remarkable image processing algorithms, a non-contact video-
grammetric system for vibration monitoring has been present-
ed. The methods of the videogrammetric system are based on
the principles of close-range photogrammetry and computer
vision, and mainly consist of the following steps: camera cali-
bration, target recognition, matching and tracking, 3D spatial
coordinate sequence reconstruction based on bundle adjust-
ment and forward intersection, smoothing filter, and dynamic
parameter calculation. The performance and feasibility of the
presented system was demonstrated by a monitoring experi-
ment of large-scale shaking table tests with a landslide dam
model. Several conclusions can be drawn, as follows:
1. The comparison results of two simulated tests and one
static test validate the robustness and reliability of the pro-
posed subpixel phase correlation method. The proposed
method outperformed six representative Fourier-based
correlation methods and four variants in the simulated
tests and three popular target tracking methods in the
static test.
2. The monitoring results of large-scale shaking table tests
show that the displacement, deformation, and acceleration
of the tracking points were successfully obtained by the
videogrammetric measurement, which reflect the detailed
3D dynamic responses of the structural vibration and agree
well with the physical conditions. Ten checkpoints were
used to assess the performance, and a sub-millimeter level
of both absolute and relative discrepancy was achieved.
3. The measured accelerations accord well with the original
seismic wave and acceleration sensors, which confirms
the effectiveness of the presented system.
The presented system is shown to be a cost-effective
complement to the traditional sensors for measuring 3D vibra-
tion response, which can be easily adapted to the observation
configuration with more cameras and different applications.
Therefore, more high-performance cameras will be explored
in other complicated applications with larger deformations
and in the outdoor scenario in our future work. In addition,
technical refinements will be further considered to enhance
the automation and precision, such as improving the compu-
tational efficiency of the proposed phase correlation method,
Figure 8. Comparison of the acceleration time histories obtained from the acceleration sensor and videogrammetric system:
(a) T6 versus no. 12908, and (b) T7 versus no. 12904.
590
September 2018
PHOTOGRAMMETRIC ENGINEERING & REMOTE SENSING


