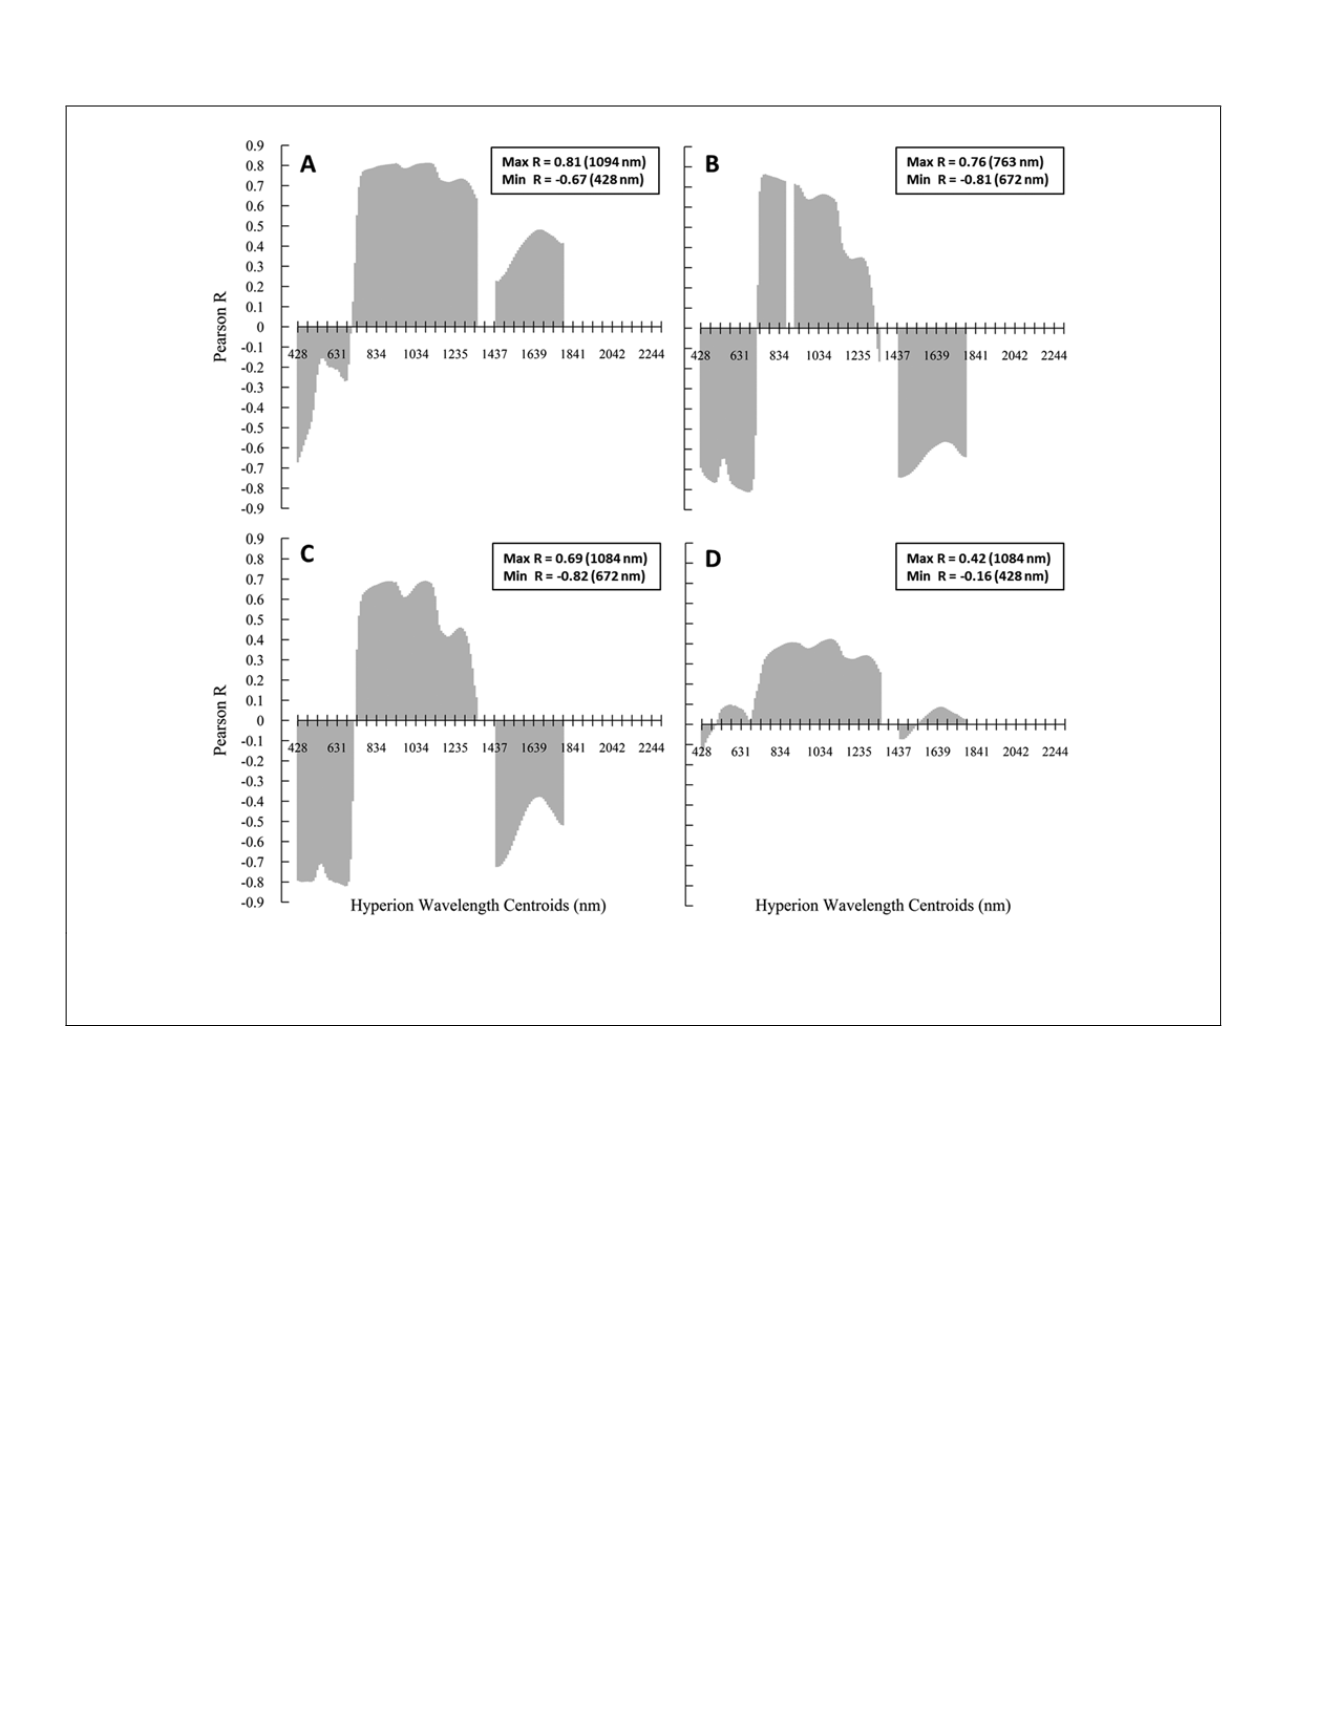
NIR
reflectance and high negative correlations with visible
reflectance. Correlations in the red-edge are high, but the
direction is less consistent across crop types. Rice had the
highest correlations in the
NIR
, followed by alfalfa, cotton, and
maize. Unlike alfalfa and cotton, rice biomass is sensitive to a
much narrower range of
HNB
s in the visible and correlations
are lower. In addition, biomass is positively correlated to
SWIR
reflectance. Alfalfa shows high correlations particularly near
the red-edge and the highest correlations in the
SWIR
com-
pared to other crops. The results for maize are less compara-
ble with other crop types and correlations are lower. Maize
shows much higher correlations around important inflection
points (468, 560, 672, 1013, 1145, 1215, 1225, 1235, and 1326
nm) after the first derivative transformation of
HNB
s (Figure 3).
Correlations for the other crops are also higher after the first
derivative transformation, but over a much narrower range of
HNB
s. This is particularly the case around major water absorp-
tion bands in the
SWIR
. In addition, unlike the untransformed
spectra, the direction of correlations is consistent across crop
types in the
SWIR
. Second derivative correlations (not shown)
are more variable than the first derivative transformed spectra.
Correlations overall are typically lower than the first deriva-
tive transformed or untransformed spectra.
Two-band HVIs
The strength of two-band
HVI
s is illustrated with lamb-
da-lambda (R
2
) contour plots in Plate 2. The dark red regions
in Plate 2 pinpoint where two NBs combine in an
NBVI
that
correlates highly with biomass. As in the 1
D
plots, the correla-
tions between reflectance ratios and biomass are the highest
for rice, but over a much narrower range compared to alfalfa
and cotton. Again, maize shows the lowest correlations, with
none of the 2-band ratios having an R
2
>0.5 with biomass. The
best predictor of biomass for rice is at 1205 and 1256 nm (R
2
= 0.83), which is within a narrow range of the
NIR
from 1185
to 1276 nm. Strong, but relatively lower correlations occur
across the
NIR
centered at 743 nm and visible at 550 nm. A
wider range of relatively high correlations occurs between
SWIR
(1326 to 1740 nm) and
NIR
bands. Alfalfa two-band ratios
show high correlations with biomass across the visible,
NIR
,
and
SWIR
. Alfalfa is the only crop to show significant correla-
tions in the
SWIR
2 (2032 to 2274 nm). Red-edge ratios (611 to
712 nm) are the highest correlated with alfalfa biomass- the
best being at 641 and 702 nm (R
2
= 0.80). These are followed
by red-edge and
NIR
,
NIR
and
SWIR
,
SWIR
and
SWIR
, and lastly
SWIR
2 and
SWIR
2 ratios. As with alfalfa, cotton shows high
correlations across the full measured spectrum, except for the
SWIR
2-
SWIR
2 ratios. The highest correlations occur between
the visible and
NIR
, particularly around 550 nm and 722 to
1326 nm. The highest is at 550 and 1124 nm (R
2
= 0.83).
Figure 2. Pearson correlation coefficients (R) between 186 untransformed and discrete (10 nm) channel reflectance and crop
biomass for (A) rice, (B) alfalfa, (C) cotton, and (D) maize. Ten of the bands at the end of the
swir
2 have been removed, because of
irregularities between the samples.
762
August 2014
PHOTOGRAMMETRIC ENGINEERING & REMOTE SENSING


