Two-band and Multiple Band Model Validation
The models selected from the calibration subset using 2-band
NBVI
s, multi-band
FA
, and multi-band
PCR
for the untrans-
formed and first derivative transformed spectra are used to
evaluate the models with the validation subset. The first
derivative transformed
NBs
have higher correlations with the
validation subset using all three approaches. When correlat-
ing
NBVI
s calibration and validation biomass subsets, the
ranks of such correlations are more consistent for the first
derivative transformed spectra as well. Overall, the predicted
biomass derived from the three approaches tends to under-
estimate actual biomass when biomass is low, while higher
biomass predictions tend to be more variable.
The scatterplots of actual biomass versus predicted
biomass using 2-band
NBVI
s are shown in Figure 4. With the
exception of maize, the top
NBVI
from the calibration subsets
for each crop type performed well, but worse than during the
calibration analysis. Many of the
NBVI
s ranked below the top
NBVI
shown in Table 2, performed as well, if not better on the
validation subset. These were primarily in the visible green
and
NIR
for alfalfa and visible blue and
NIR
for cotton. Rice
was more divergent, showing high performing
NBVI
s on the
validation subset between the visible green and
NIR
, as well as
the
NIR
and
SWIR
1.
The correlations between the
FA
models shown in Figure
5 and actual biomass are comparable to the 2-band
NBVI
’s. As
with the 2-band
NBVI
s, low biomass tends to be under-pre-
dicted, while higher biomass predictions tend to be more
variable. Overall, the
FA
approach performs better than the se-
lected
NBVI
s on the validation subset. The deviations from the
1:1 line (residuals), indicated by the Root Mean Squared Error
(
RMSE
), are higher than the
NBVI
approach for rice and alfalfa,
but lower than the
NBVI
approach for cotton and maize. Un-
like the two-band approach, rice only uses one predictor near
the
SWIR
(1336 nm), while the other crops use three predictors
in the
FA
models. Alfalfa includes two
SWIR
predictors (1447
and 1770 nm), but
NIR HNBs
tend to enter the model first. The
PCR
models shown in Figure 6
yield the lowest correlations
with actual biomass and have higher
RMSE
.
Discussion
The study makes three important contributions to the design
of upcoming satellite research missions with the intent of
monitoring water-intensive crops across the globe: (a) bio-
mass, a key component of crop water productivity, can be
simulated using crop-specific spectral properties determined
across various crop varieties, soil types, climatology, and
growth stage; (b) first derivative transformed spectra minimize
mixed spectra effects and yield higher correlations particular-
ly at longer wavelengths; and (c) sequential search methods
are more robust and explain more biomass variance than
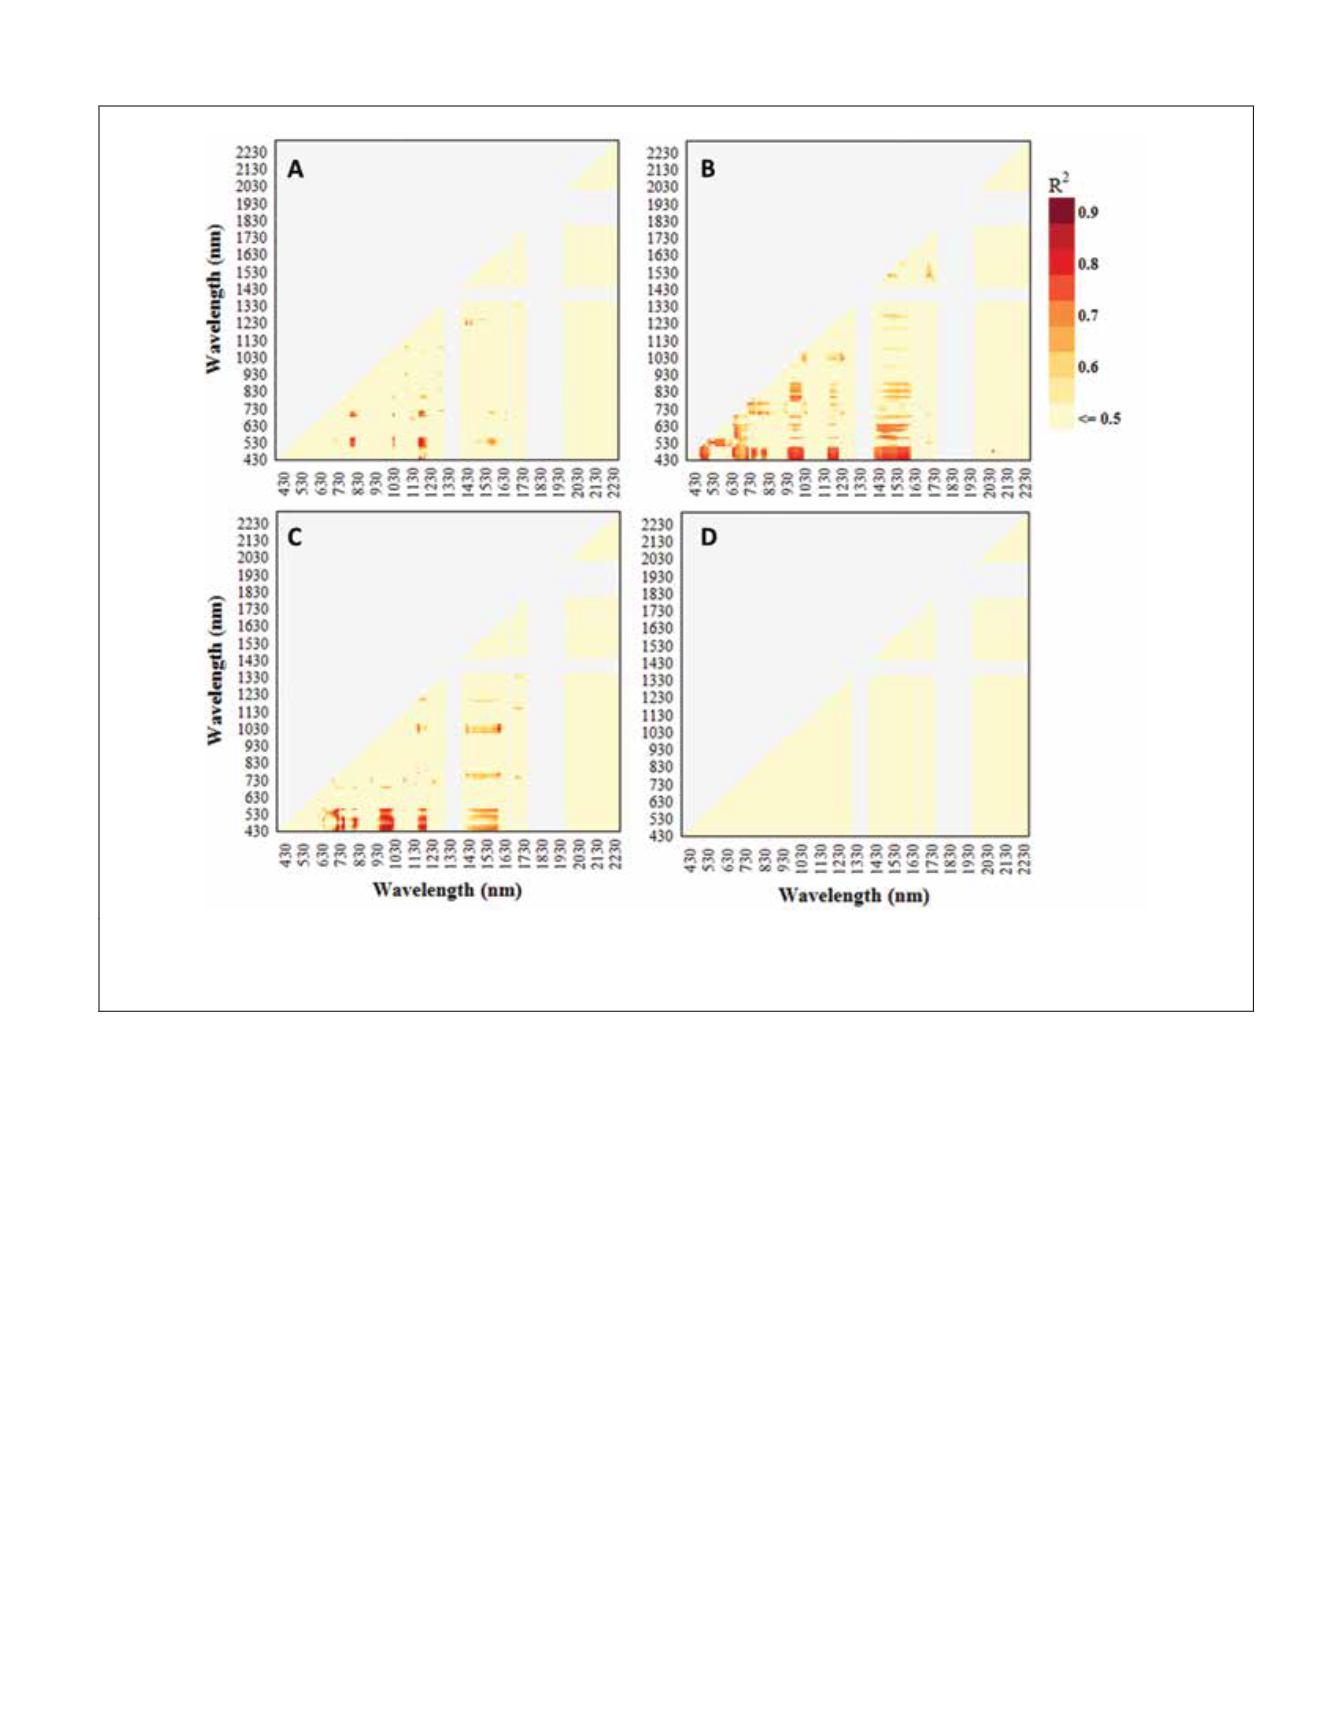
Plate 3. Lambda-lambda (R
2
) contour plots, based on 186 first derivative transformed and discrete (10 nm) bands and crop biomass
for (A) rice, (B) alfalfa, (C) cotton, and (D) maize. Dark red regions highlight potential two-band
hvi
s
. Ten of the bands at the end of the
swir
2 have been removed, because of irregularities between the samples.
PHOTOGRAMMETRIC ENGINEERING & REMOTE SENSING
August 2014
765


