to a potential source of error: the height at which the spectra
were collected. The spectra were collected at 2.5 m, which at
the beginning growth stage was sufficiently above the canopy.
As the maize matured, however the sensor was just above the
canopy or in some cases, when the maize unpredictably grew
to over 3 m, within the canopy. In these cases, spectra most
likely captured a single leaf exposed to sunlight or in shad-
ow, as opposed to the entire canopy, significantly impacting
the spectra, yet went undetected during data processing.
Mounting the
ASD
on a cherry-picker could have avoided this,
but was not available to us at the time. In a follow-up to this
study, multiple hyperspectral and multi-spectral broadband
satellite remote sensing data will be analyzed and combined
to improve crop biomass estimates over larger areas. Since
these sensors are well above the canopy, we expect significant-
ly better correlations in the red-edge and
NIR
for maize, com-
parable to Thenkabail et al. (1994) who explained 80 percent
of the biomass variability for maize using a combination of
NIR
,
SWIR
and thermal Landsat Thematic Mapper bands.
Conclusions
The study used HBNs and
HVI
s to model aboveground fresh
biomass for four leading world crops: alfalfa, cotton, maize,
and rice. Three distinct model types were investigated using
untransformed, first derivative transformed, and second deriv-
ative transformed spectra: two-band
HVI
s,
MB-HVI
s using
SSM
and
MB-HVI
s using
PCR
. In most cases, one to three
HNB
s ex-
plained more than 70 percent of the biomass variability in the
validation subset, while figures are higher in the calibration
subset. Both the two-band
HVI
and
MB-HVI
(
SSM
) approaches
using first derivative transformed spectra performed the best
overall and are comparable. The two-band
HVI
approach, how-
ever, needs to be revisited, as many of the two-band
HVI
s that
performed well in the calibration phase, performed as well, if
not better than any other technique on the validation subset.
Two-band
HVI
s tended to include visible green and
NIR
for al-
falfa, visible blue and
NIR
for cotton, visible green and
NIR
and
NIR
and
SWIR
for rice, and
NIR
and
SWIR
for maize.
The need to design water-saving techniques in the Central
Valley of California and other semi-arid irrigated agricultur-
al regions of the world is increasing, as population growth,
competing sources, and climate change increase the demand
for global water supply. Crop biomass is used extensively in a
predictive capacity to measure yield and to monitor crop water
productivity. The next step in the analysis will involve compar-
ing the technique using multiple broad-band and
HNB
space-
borne remote sensing platforms, as well as to refine broad-band
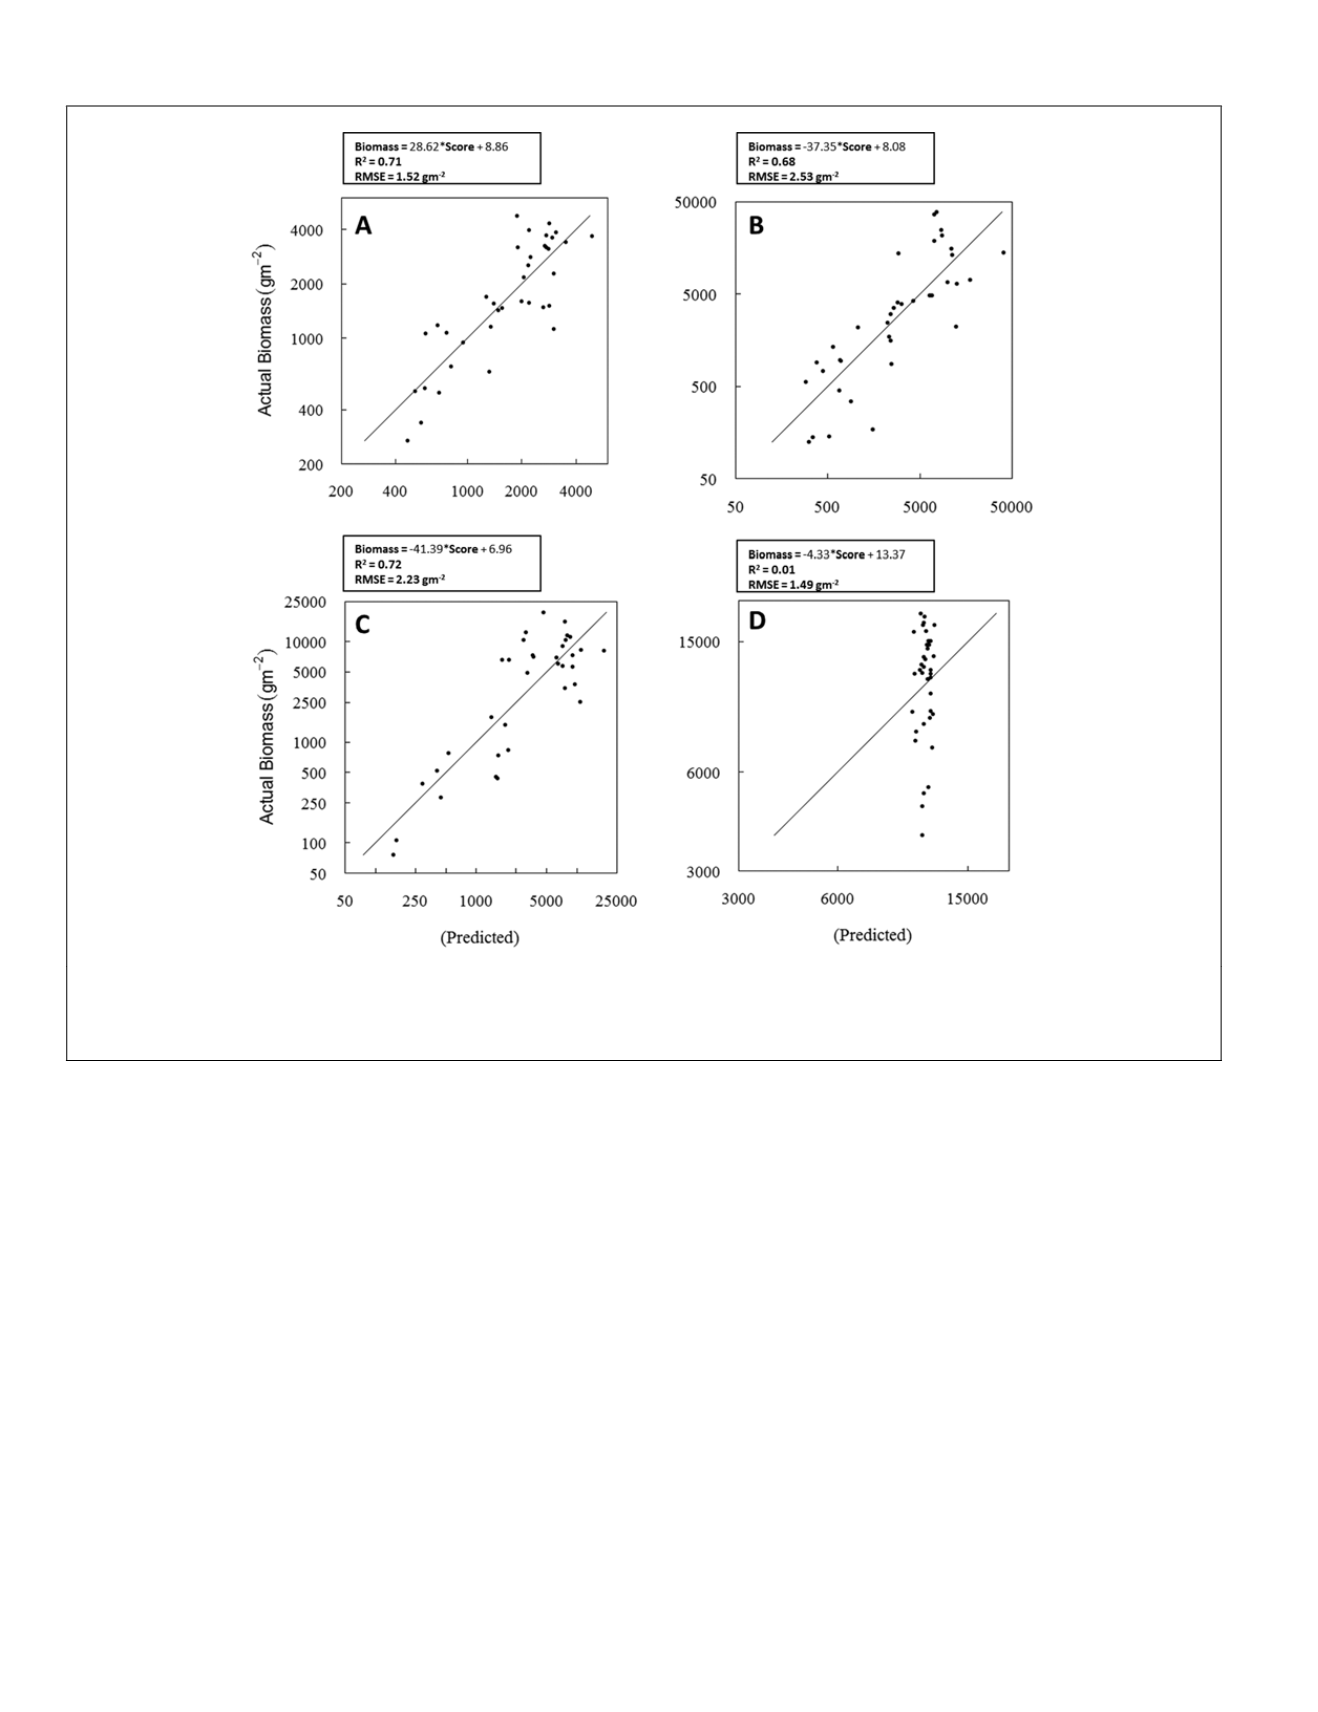
Figure 6. Scatterplots of observed biomass versus predicted biomass derived from
pca
scores determined from
pca
weights and vali-
dation subset for (A) rice, (B) alfalfa, (C) cotton, and (D) maize. The correlations are based on the first derivative transformed spectra
for all crop types. Scores were derived from the first two components, except maize, which uses three.
770
August 2014
PHOTOGRAMMETRIC ENGINEERING & REMOTE SENSING


