in the Dual-Wavelength Echidna
®
Lidar (
DWEL
) instrument in
engineering trials with data obtained using the near-infrared
(
NIR
) laser in the Echidna
®
Validation Instrument (
EVI
), and
found that leaf reflectance intensities were lower at
SWIR
than
at
NIR
, and trunks were about twice as bright as leaves at
SWIR
.
These results suggest that multi-wavelength information can
be used for wood-leaf separation. However, the development
of multi-wavelength lidar is still in the early stages (Kaas-
alainen
et al.
, 2007; Chen
et al
., 2010). In addition to intensity
and multi-wavelength approaches, Yao
et al
. (2011) and Yang
et al
. (2013) classified trunk/branch or foliage hits by thresh-
olding the relative widths of the return waveforms. However,
full-waveform data can only be produced using a few lidar
platforms, so this approach has not been widely adopted.
Apart from intensity (including the multi-wavelength
approach) and waveform information, the 3
D
x-
,
y-
,
and
z-
coordinates of each point are the most fundamental infor-
mation acquired by a lidar system. The appropriate use of
3
D
point cloud information might therefore provide a more
general method for wood-leaf separation. To the best of our
knowledge, wood-leaf separation using the
x-
,
y-
,
and
z-
coor-
dinates of each point has rarely been reported. Xu
et al
. (2007)
performed wood-leaf separation using 3
D
point cloud infor-
mation and Dijkstra’s shortest-path algorithm (Dijkstra, 1959).
However, because the focus of their work was leafy tree mod-
eling, wood points were loosely defined as having a geodesic
distance to the root that was less than a threshold (around
two-thirds of the tree height), and this might lead to false clas-
sification of a large amount of wood points as leaf points.
In the present research, we developed a geometric method
for separating wood points from leaf points, using only 3
D
information from a T-lidar point cloud. This method was
inspired by the observation that trunk/branch boundaries ap-
pear as circles or circle-like shapes (such as arcs or incomplete
circles) in point slices, whereas leaf clusters can be abstracted
as line segments. We identified these geometric primitives
using common algorithms such as the shortest-path algorithm
for graph analysis (Xu
et al.
, 2007; Cote
et al
., 2009; Livy
et al.
,
2010) and the medial axis transform (Verroust and Lazarus,
2000) for simplifying complex shapes. We tested the effective-
ness of this new method using two broad-leaved trees and
one virtual tree. The results were compared with photographs
taken during the leaf-off period and with results obtained
using the intensity approach. More details of the dataset and
algorithm are provided in the remainder of this paper.
Data
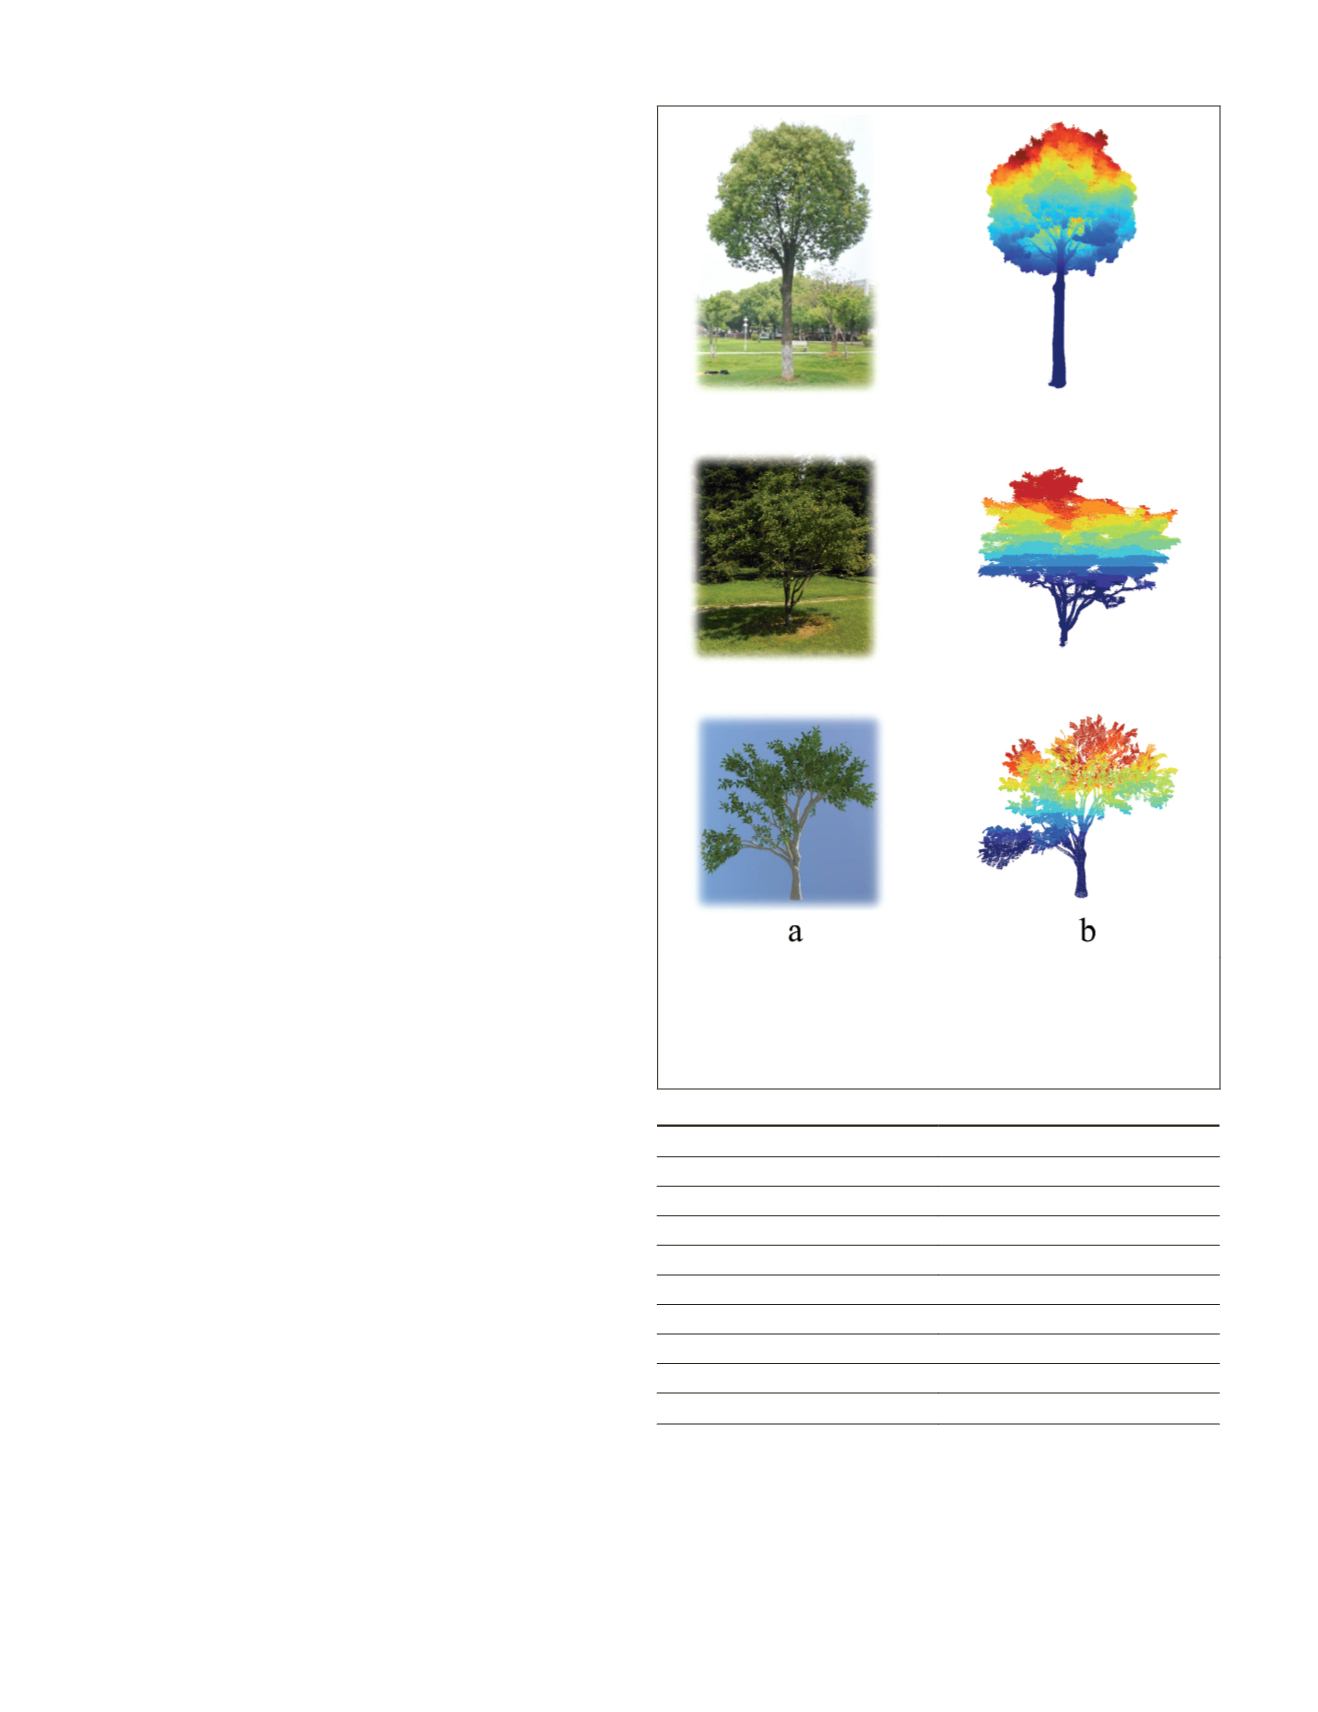
A Riegl VZ-400 (Riegl, Inc., Austria) T-lidar instrument was
used to scan a camphor tree (
Cinnamomum camphora
, Plate
1) at the China University of Geoscience, Wuhan, China in
May 2012, and a magnolia tree (
Magnolia denudata
, Plate 1)
at the Institute of Botany, the Chinese Academy of Sciences,
Beijing, China in August 2013. The Riegl VZ-400 emits laser
pulses at a wavelength of 1550 nm, and spans 360° horizontal-
ly and 100° vertically, with a maximum scanning range of 600
m. The accuracy at 100 m is 2 mm, according to the instru-
ment vendor (the instrument specification is given in Table 1).
The camphor tree (7.25 m, ground to tip) was scanned at
azimuthal angles of 0°, 90°, 180°, and 270°, at a constant dis-
tance of about 5 m. The magnolia tree (2.62 m, ground to tip)
was scanned at azimuthal angles of 0°, 120°, and 240°, at the
same distance as for the camphor tree. The final point cloud,
which contained a total of 4,454,977 points for the camphor
tree and 2,644,468 points for the magnolia tree, was obtained
by integrating separately scanned point clouds using
RISCAN
PRO software (Riegl, Inc., Austria).
In addition to the two trees scanned using T-lidar, we
simulated the point cloud of a virtual tree developed using the
L-system. The virtual tree (3.63 m, ground to tip) was created,
using Maya
TM
software, in the form of triangular meshes, with
leaf and wood separation (Plate 1). Physically based ray-tracing
(
PBRT
), a general and robust full-scale global illumination ren-
derer (Pharr and Humphreys, 2004), was then used to generate
the point cloud of the virtual tree.
PBRT
was successfully used
by Cote
et al
. (2009) to simulate point clouds identical to those
Plate 1. Trees and their point clouds for testing the proposed
geometric method for wood-leaf separation: (a) Photographs of
camphor (first row) and magnolia (second row) trees, and illustra-
tion of virtual tree developed using L-system (third row), and (b)
point clouds of camphor and magnolia trees (scanned by Riegl
VZ-400), and the virtual tree (simulated using PBRT software).
T
able
1. S
pecification
of
R
iegl
V
z
-400 T
errestrial
L
idar
S
ystem
Field of view
Horizontal: 0 - 360°
Vertical: −40° to 60°
Effective measurement rate
Up to 122 000 measurements/s
Detection range
600 m at 90% reflectivity
Laser beam divergence
0.35 mrad
Scanning accuracy
2 mm at 100 m distance
Minimum range
1.5 m
Laser wavelength
Near infrared
Camera
Equipped with Nikon D300s
Scanner weight
9.8 kg
768
October 2015
PHOTOGRAMMETRIC ENGINEERING & REMOTE SENSING


