of wood points decreased significantly with increasing
t
1,
and the quantity of leaf points increased significantly with
increasing
t
2.
Discussion
Our results suggest that the wood-leaf separation accuracy
of the simulated point cloud was better than those of the
camphor and magnolia trees (Figure 5). Specifically, 10.7
percent, 16.9 percent, and 13.4 percent true wood points were
falsely classified as leaf points for the virtual, magnolia, and
camphor tree, respectively, by the geometric method, and 1.6
percent, 3.1 percent, and 2.5 percent true leaf points, respec-
tively, were falsely classified as wood points (Table 2). The
false classification of leaf points as wood points can be at-
tributed to the inappropriate search radius used in Step 6. For
convenience of calculation, a constant search range (13 cm)
was assigned to each skeleton wood point of the three trees.
Consequently, the search radius for the skeleton points at
the stem ends might be too large, therefore leaf points within
the search range were falsely classified as wood points. This
phenomenon was more pronounced for the magnolia tree
than for the camphor tree. This is partly because the mag-
nolia tree was smaller (2.62 m in height), which made circle
detection more difficult, because thin branches were more
sparsely scanned than bigger branches under a given scanning
mode. Another possible reason for the inferior results for the
magnolia tree is that it has larger leaves, and small twigs tend
to be more shaded.
The superiority of the geometric method to the intensity
approach was demonstrated by quantitative assessments
(Table 2) as well as by visual comparisons (Figures 5, 6, and
7). These two approaches are based on different concepts. The
geometric method operates on the geometric part of a tree,
whereas the intensity approach deals with each point. There
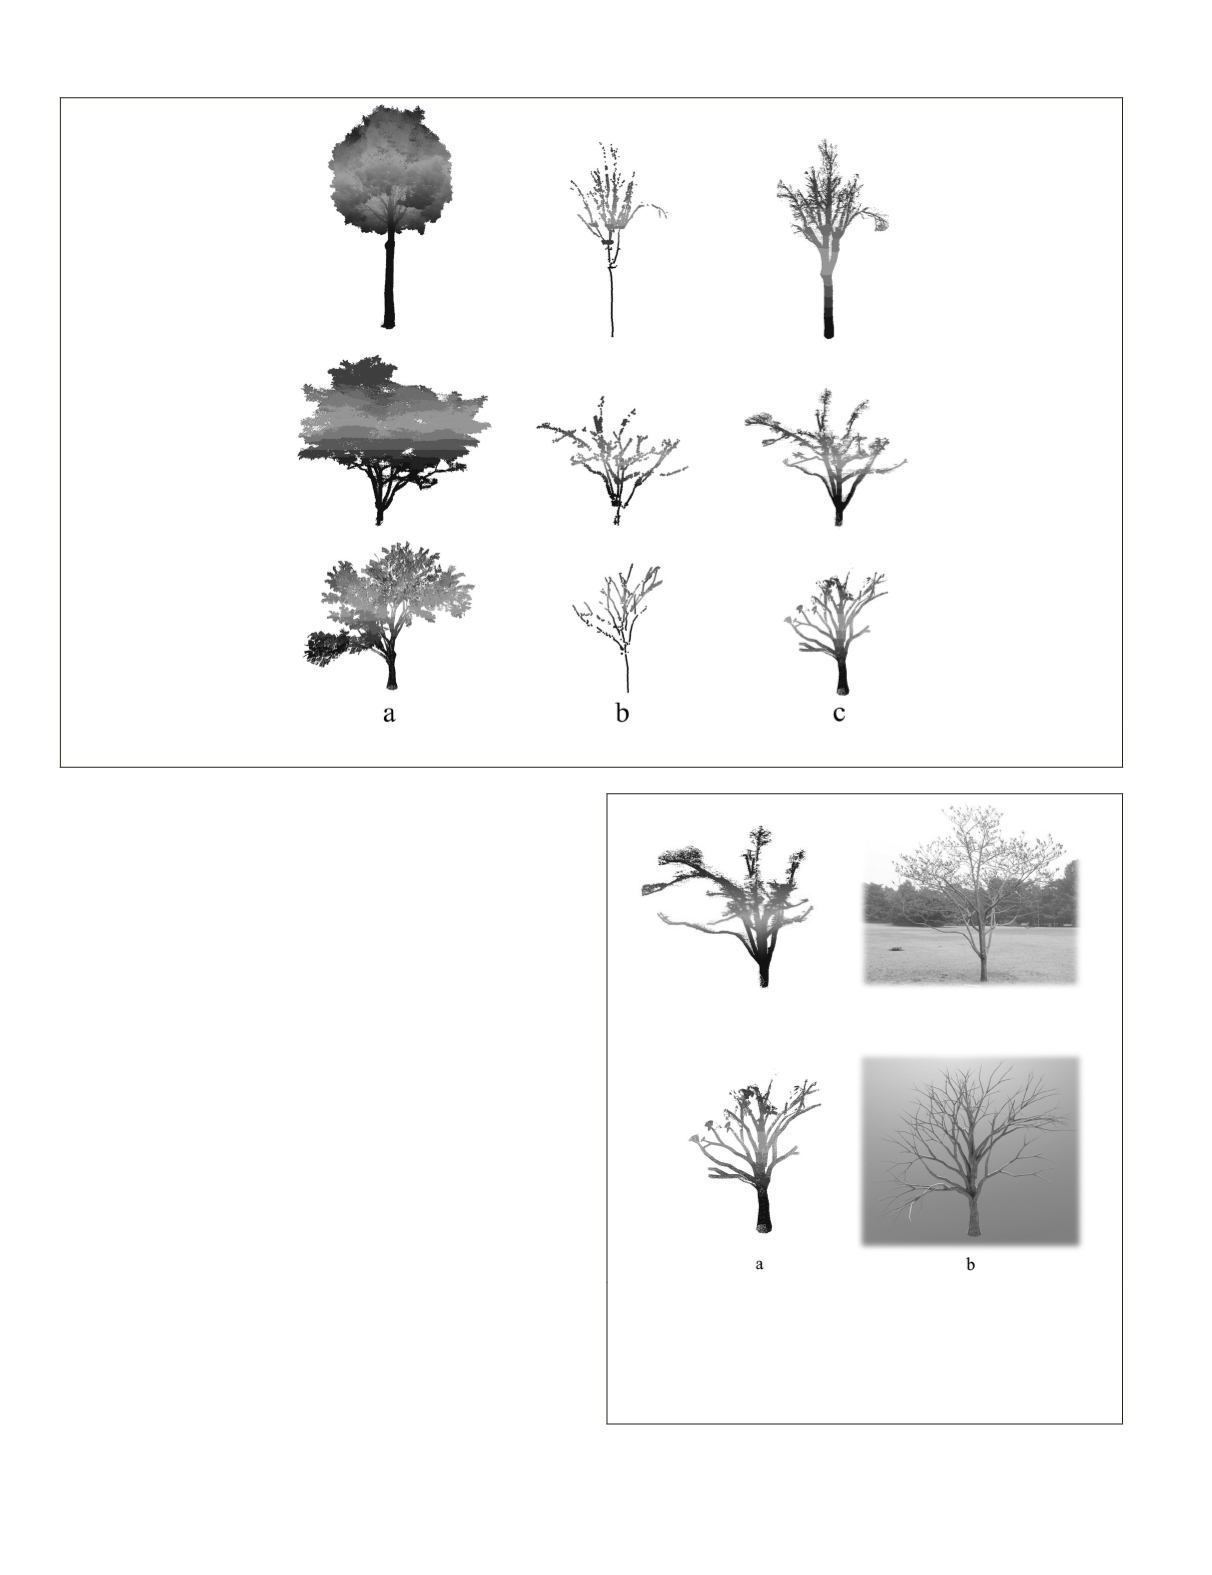
Figure 5. Results of wood-leaf separation using the geometric method for camphor tree (first row), magnolia tree (second row), and virtual
tree (third row): (a) raw point clouds, (b) skeleton wood points, and (c) final wood points.
Figure 6. Comparison of wood parts found using (a) the geomet-
ric method, and (b) a real photograph. The photograph of the
magnolia tree (first row) was taken during the leaf-off period,
and that of the virtual tree (second row) was simulated using
Maya
™
. The comparison shows that first-, second-, and third-order
branches are found by the geometric method, but tiny shoots are
not found, because of occlusions.
772
October 2015
PHOTOGRAMMETRIC ENGINEERING & REMOTE SENSING


