The quality analysis was also employed to evaluate the
relevance of each indicator with regards to the others. To
identify redundant indicators, all indicators were combined
and applied
en masse
to the points rejected by a given
indicator, except for the one under evaluation. The points
remaining after this all-indicator filtering of the rejected
points are those which were exclusively filtered out by the
indicator under evaluation. Their proportion, with respect
to the total amount of points originally filtered out by this
indicator, provided the means to assess whether a given
indicator was indispensable.
Results and Discussion
The quality analysis of the filtering method will be presented
and discussed through the vertical accuracy analysis, the
exclusive filtering analysis, and the impact of snow on the
vertical accuracy.
Vertical Accuracy Analysis
The quality analysis of the vertical accuracy accounts for both
the filtered points (Table 1) and those rejected (Table 2) by
each indicator and their en masse combination. First,
GLA14
elevations were compared to the
CDED
reference values after
outlier removal. Their difference was quantified in terms of
RMSE95
values (Table 1). The difference between the
RMSE95
values with indicator filtering of the
GLA14
elevations (both in-
dividually and combined) less the
RMSE95
values after outlier
removal corresponds to the general decrease in elevation error
(Δ
RMSE95
of Table 1) and thus increased elevation accuracy.
The
RMSE95
values of the rejected points were then associated
with the proportion of filtered points for each indicator as well
as for the combined-indicators applied
en masse
(Table 2).
As expected, Table 1 shows a substantial increase in the
vertical accuracy (reduction of root mean square errors) after
removing the outliers. This result is notable because of the
very poor vertical accuracy (368.46 m) characterizing the few
elevation points rejected as outliers (8 percent) (Table 2).
As shown in Table 1, the filtering of some indicators, such
as the slope, attitude and saturation provided a very small
decrease in error. In fact, very few points were rejected by
these indicators (Table 2) because of the modest topographical
variations in the
AOI
. The relative flatness of the
AOI
meant
that inaccurate attitude had very little effect on the elevation.
As for the slope indicator, it rejected very few points since
most of the slopes were within the 0 to 10 percent range over
the study site. However, despite the low number of points,
the points rejected by the slope indicator had a very high
RMS
elevation error (18.30 m), showing the potential usefulness of
this indicator over rugged areas. In such environments, the
application of both the slope and the attitude indicators could
further contribute to a decrease in the
RMSE95
.
The greatest reduction in
RMSE95
values was obtained
using the gain (1.08 m) and the number of peaks (0.96 m)
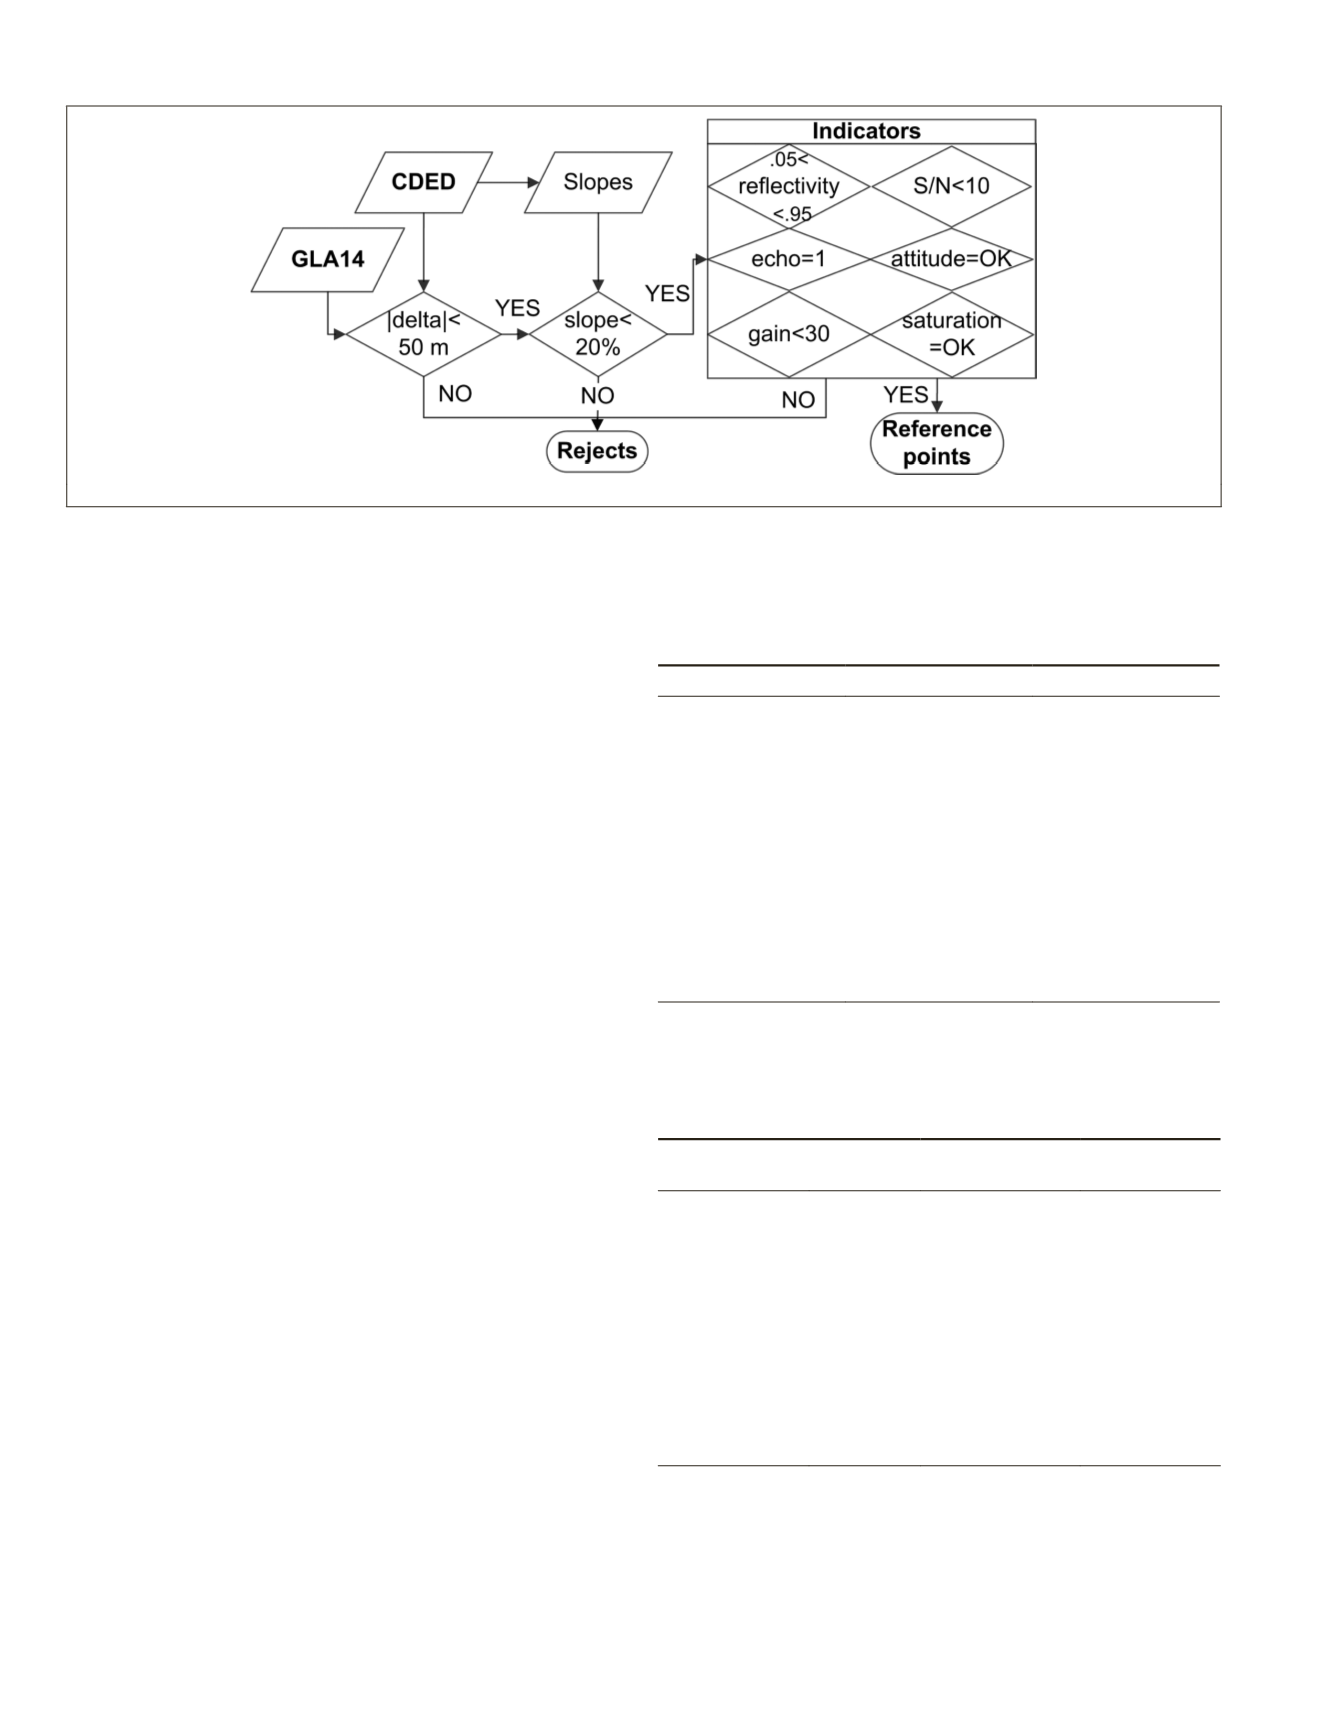
Figure 3. Flowchart outlining the indicators in the filtering method.
T
able
1. R
oot mean
square
elevation
error
(
rmse
95
)
and
the
decrease
in
rmse
95
after
filtering
(
Δ
rmse
95
). T
he
elevation
reference
for
all
the
filtered
cases
(
all
rows
save
the
row
labeled
“
none
”)
was
the
canadian
digital
elevation
data
(
cded
)
grid
;
the
rmse
95
reference
for
all
Δ
rmse
95
calcula
-
tions was
the
value
of
7.13
m
. (
cf
.
the
“
exclude
outliers
”
row
),
correspond
-
ing
to
the
rmse
95
once
outliers were
excluded
from
gla
14
D
ata
Filter applied
Δ
RMSE95 (m)
RMSE95 (m)
None
-
301.94
Exclude outliers
-247.43
7.13
Slope
-0.02
7.11
Attitude
0.01
7.14
Gain
-1.08
6.05
Saturation
-0.02
7.11
Reflectivity
-0.33
6.80
Signal/Noise
-0.26
6.87
Nb of peaks
-0.96
6.17
All indicators
-1.32
5.81
T
able
2. S
tatistics
on
rejected
points
:
the
root mean
square
elevation
error
(
rmse
95
)
was
calculated
for
points
rejected
for
each
filter
of
table
1
with
respect
to
the
canadian
digital
elevation
data
(
cded
)
grid
:
the
reference
for
the
“
proportion
(%)”
is
the
initial
number
of
points
before
exclusion
of
the
outliers
(
72,860
)
Filter applied
RMSE95
(m)
Number of
rejected points
Proportion
(%)
Exclude Outliers
368.46
5829
8%
Slope
18.30
365
<1%
Attitude
6.17
1459
2%
Gain
7.78
40802
56%
Saturation
7.55
2289
3%
Reflectivity
8.15
14580
20%
Signal/Noise
12.87
2106
3%
Nb of peaks
8.59
24786
34%
All indicators
7.61
50301
69%
704
September 2015
PHOTOGRAMMETRIC ENGINEERING & REMOTE SENSING


