each evaluation polygon and therefore, results are not likely
sensitive to omission or commission errors of one or several
pixels during the digitizing of evaluation polygons
.
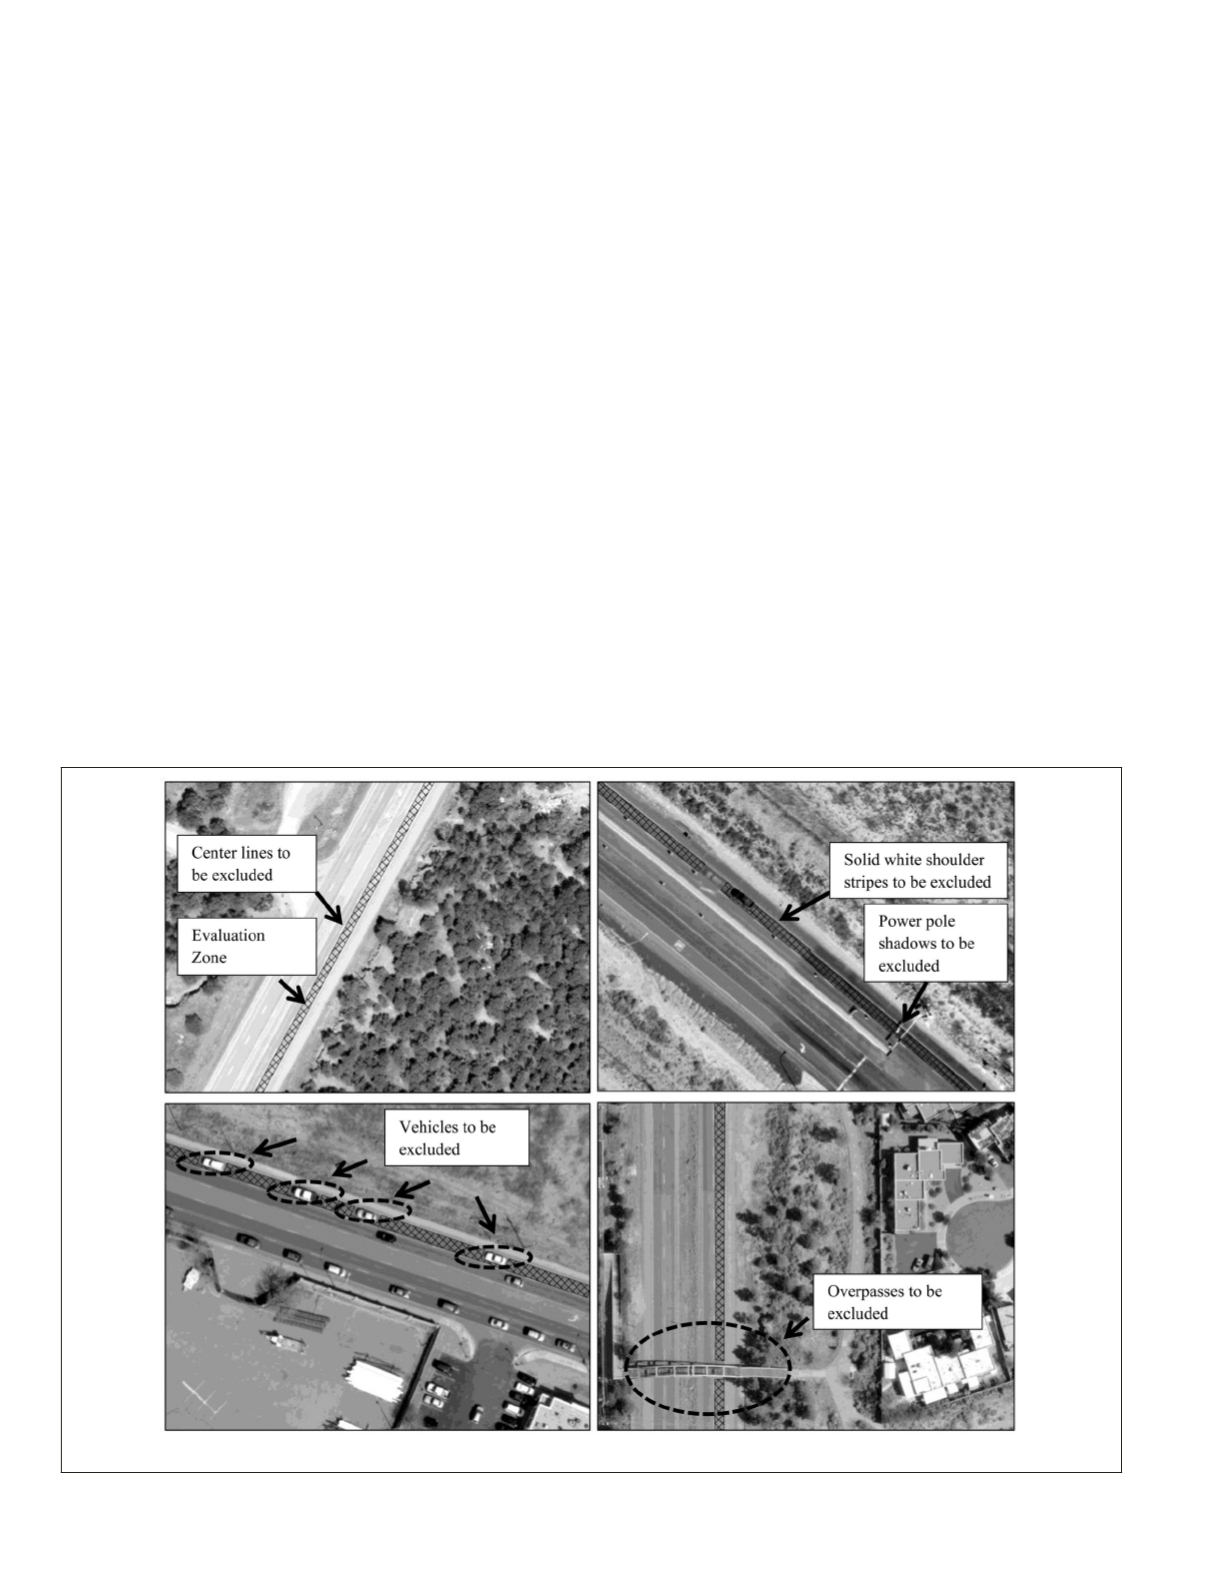
When creating the evaluation polygons, six types of
features on the ground were excluded since they are consid-
ered to be noise. These features are center lines, solid white
shoulder stripes, other pavement markings, overpasses, power
pole shadows, and vehicles. Figure 1 illustrates the excluded
features mentioned above.
Image Degradation
Most counties and municipalities routinely collect
HSR
mul-
tispectral digital aerial photography. The spatial resolution of
most of these images is between 6-inch and 1-meter (40-inch).
In order to examine how well overall pavement surface distress
can be estimated from routinely collected
HSR
multispectral dig-
ital aerial photography, the set of 6-inch aerial photography was
degraded to 12-inch (0.3048-meter) and 24-inch (0.6096-meter)
aerial photography. This set of 6-inch aerial photography was
not degraded to 1-meter because previous research completed
by Zhang and Bogus (2014) showed that 1-meter natural color
digital aerial photography lacks the spatial resolution to detect
overall pavement distress conditions effectively.
Spectral Response Extraction
Only the data within the evaluation polygons are comparable
to known
ODR
rates. Once evaluation polygons were digitized
to correspond to the collected reference or actual
ODR
data,
statistics (e.g., mean, median, standard deviation, variety,
majority, minority, maximum, minimum, range, and sum)
summarizing the pixel values contained within those evalua-
tion polygons were extracted for each resolution.
Multiple Linear Least Squares Regression Analysis
Variables
The dependent variable, or response variable, used in this
study is the
ODR
described in the previous section.
ODR
was
calculated for the field pavement surface distress data col-
lected through manual inspection.
Selecting the most appropriate independent variables from
the statistics mentioned in the previous section is neces-
sary for building the regression model. According to Herold
(2007), the mean value of the spectral response of the visible
wavelengths has a significant negative relationship with
ODR
.
The higher the mean brightness is (higher mean brightness
value), the better the pavement surface condition is (lower
ODR
value). Pavement surface distresses (e.g., cracks) expose
deeper layers of the pavement with higher contents of the
original asphalt mix, which is then manifested in increased
hydrocarbon absorptions features (Herold, 2007). Therefore,
degraded pavement surfaces cause less reflectance with in-
creasing hydrocarbon features, while less degraded pavement
surfaces get brighter with decreasing hydrocarbon features.
Also, shadows induced by cracks decrease brightness.
In this research context, image texture, which is a first
order derivative measure of variation in brightness values,
may also be a significant variable. Theoretically, the worse
the pavement surface condition is, the more heterogeneity of
brightness values should be exhibited, due to the introduc-
tion of shadows associated with cracks and deformations and
exposure of pavement aggregate (i.e., gravels). For example,
a very good condition pavement section may have a standard
deviation value of 4, while a poor one may have standard
deviation value of 100. Pearson’s correlation analyses were
performed on a variety of texture measures, and it revealed
Figure 1. Exclusion of unwanted features on the images.
712
September 2015
PHOTOGRAMMETRIC ENGINEERING & REMOTE SENSING


