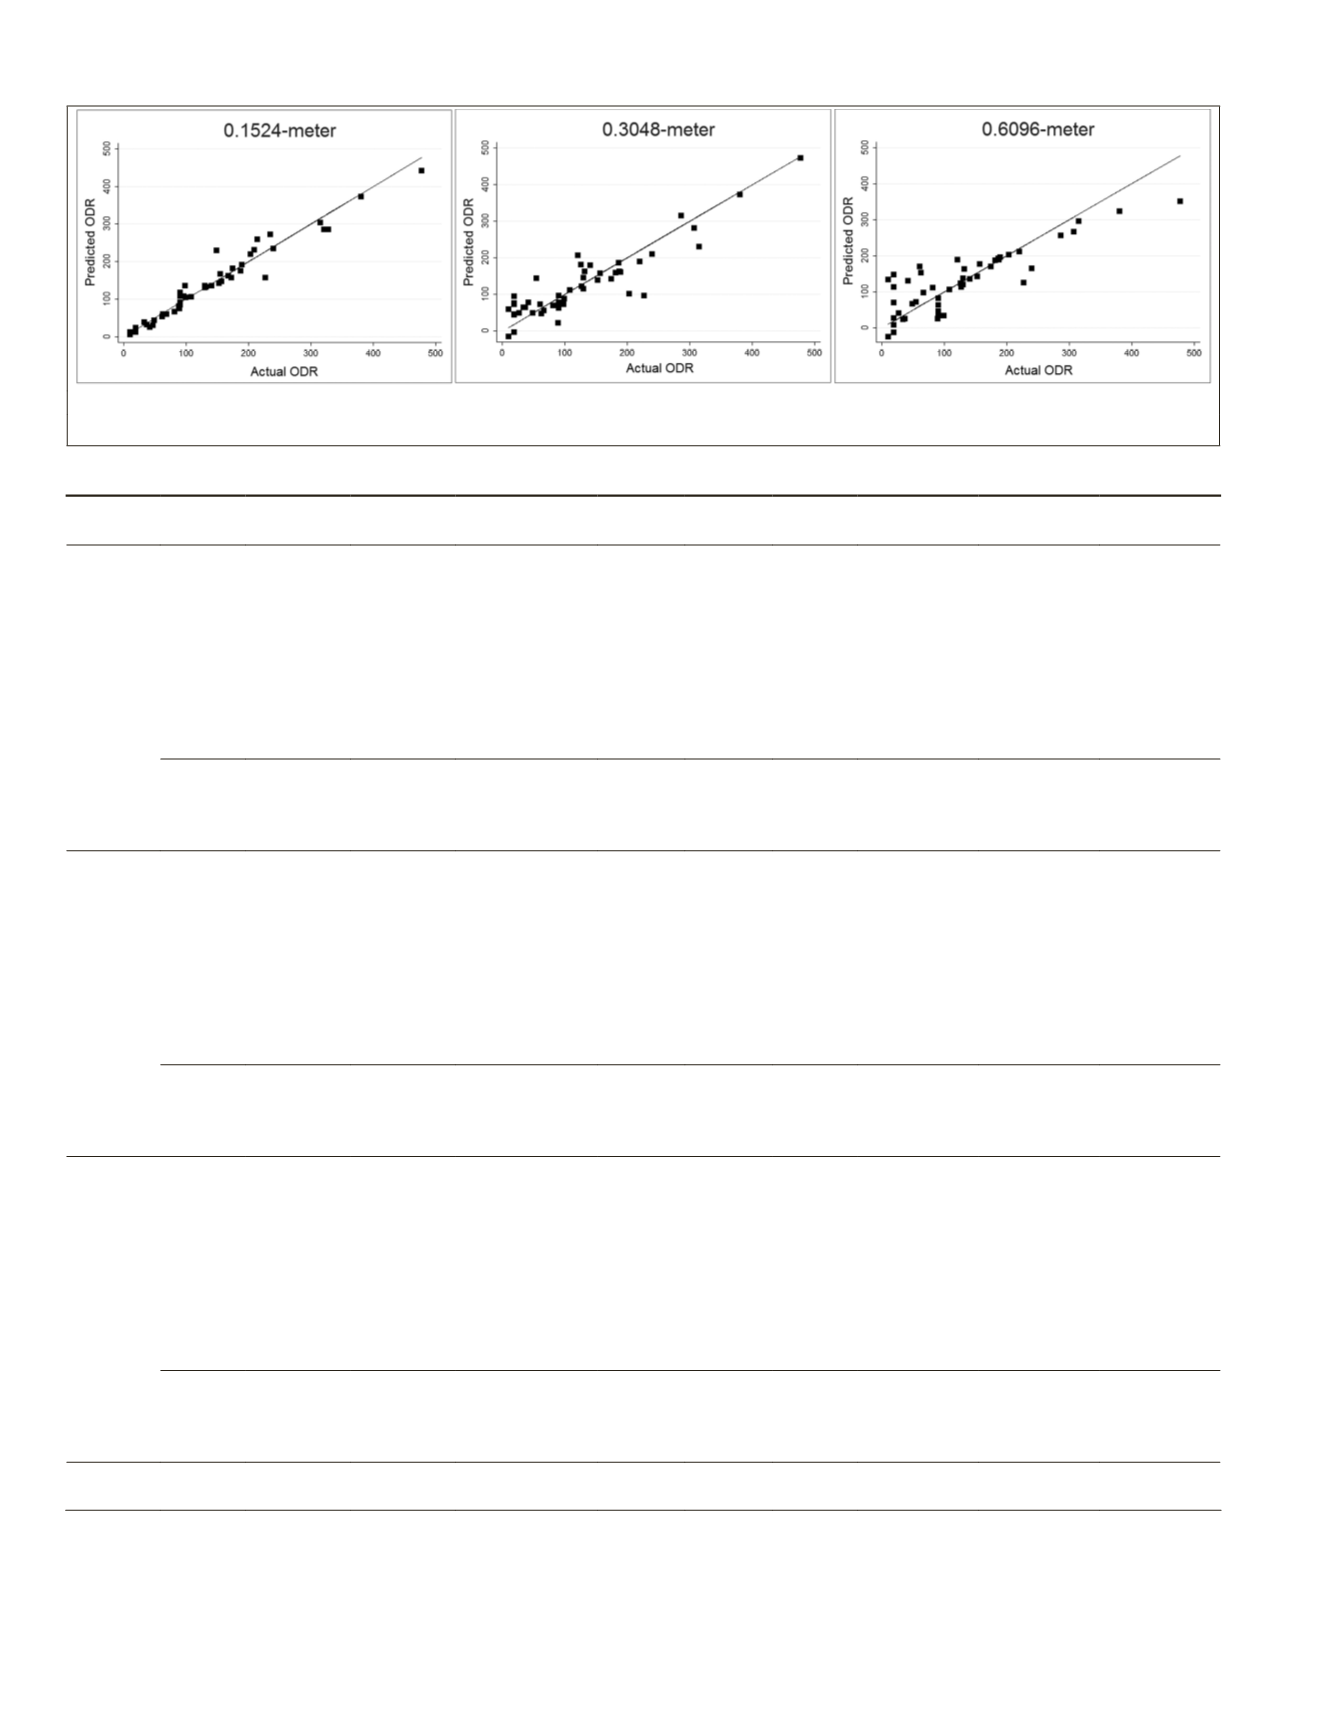
(a)
(b)
(c)
Figure 2. Correlation of predicted ODR versus actual ODR for (a) 6-inch, (b) 12-inch, and (c) 24-inch natural color digital aerial photography
T
able
4. M
odel
F
it
for
P
rediction
of
ODR V
alues
Dataset
(Size: 50)
Model # V
a
ri
a
bles Coefficient Standard Error
t
P>|t|
R
2
Adjusted R
2
RMSE
Prob > F
6-inch
Model 1
PC
A
1
41.08
1.45
28.35 <0.001*
0.9507
0.9439
24.087
<0.001*
PC
A
2
-13.32
5.89
-2.26 0.029*
PC
A
3
-35.14
32.42
-1.08 0.284
PC
A
4
167.81
48.97
3.43 0.001*
PC
A
5
15.06
64.32
0.23 0.816
PC
A
6
-319.63
112.31
-2.85 0.007*
Intercept
135.36
3.41
39.74 <0.001*
Model 2
PC
A
1
41.08
1.69
24.28 <0.001*
0.9266
0.9235
28.123
<0.001*
PC
A
2
-13.32
6.88
-1.94 0.059
Intercept
135.36
3.98
34.03 <0.001*
12-inch
Model 1
PC
A
1
38.68
2.95
13.11 <0.001*
0.8208
0.7958
45.843
<0.001*
PC
A
2
14.54
6.47
2.25 0.030*
PC
A
3
-38.51
35.68
-1.08 0.286
PC
A
4
-270.99
76.67
-3.53 0.001*
PC
A
5
-77.86
106.69
-0.73 0.469
PC
A
6
-420.17
175.41
-2.40 0.021*
Intercept
125.12
6.48
19.30 <0.001*
Model 2
PC
A
1
38.68
3.41
11.33 <0.001*
0.7378
0.7266
53.045
<0.001*
PC
A
2
14.54
7.49
1.94 0.058
Intercept
125.12
7.50
16.68 <0.001*
24-inch
Model 1
PC
A
1
37.15
3.97
9.36 <0.001*
0.7167
0.6771
57.645
<0.001*
PC
A
2
-11.95
6.44
-1.86 0.070
PC
A
3
44.86
41.66
1.08 0.288
PC
A
4
269.66
69.96
3.85 <0.001*
PC
A
5
31.45
186.91
0.17 0.867
PC
A
6
-337.52
266.20
-1.27 0.212
Intercept
125.12
8.15
15.35 <0.001*
Model 2
PC
A
1
37.15
4.51
8.24 <0.001*
0.6004
0.5834
65.484
<0.001*
PC
A
2
-11.95
7.31
-1.63 0.109
Intercept
125.12
9.26
13.51 <0.001*
Note:
PC
A
1
to
PC
A
6
indicate the six principal components extracted from the mean and standard deviation values of each of the three visible
bands; RMSE indicates root mean squared error; and * indicates the independent variable is significant at p = 0.05 level.
716
September 2015
PHOTOGRAMMETRIC ENGINEERING & REMOTE SENSING


