segment. A higher degree of ORness results in a more opti-
mistic decision strategy. Conversely, a lower degree of ORness
leads to a more pessimistic solution. Being either optimistic or
pessimistic could be appropriate depending on the problem.
However, in the context of road network topology construc-
tion, selection of higher ORness values makes the
OWA
ag-
gregation values become larger. This effect increases the cost
value; therefore, lower number of line segments may belong to
the road segment set. On the contrary, if a lower ORness value
is assigned, the value of cost is decreased which results in a
higher number of line segments being considered as potential-
ly suitable road segments. In such a decision context, identify-
ing appropriate decision strategies is of great significance.
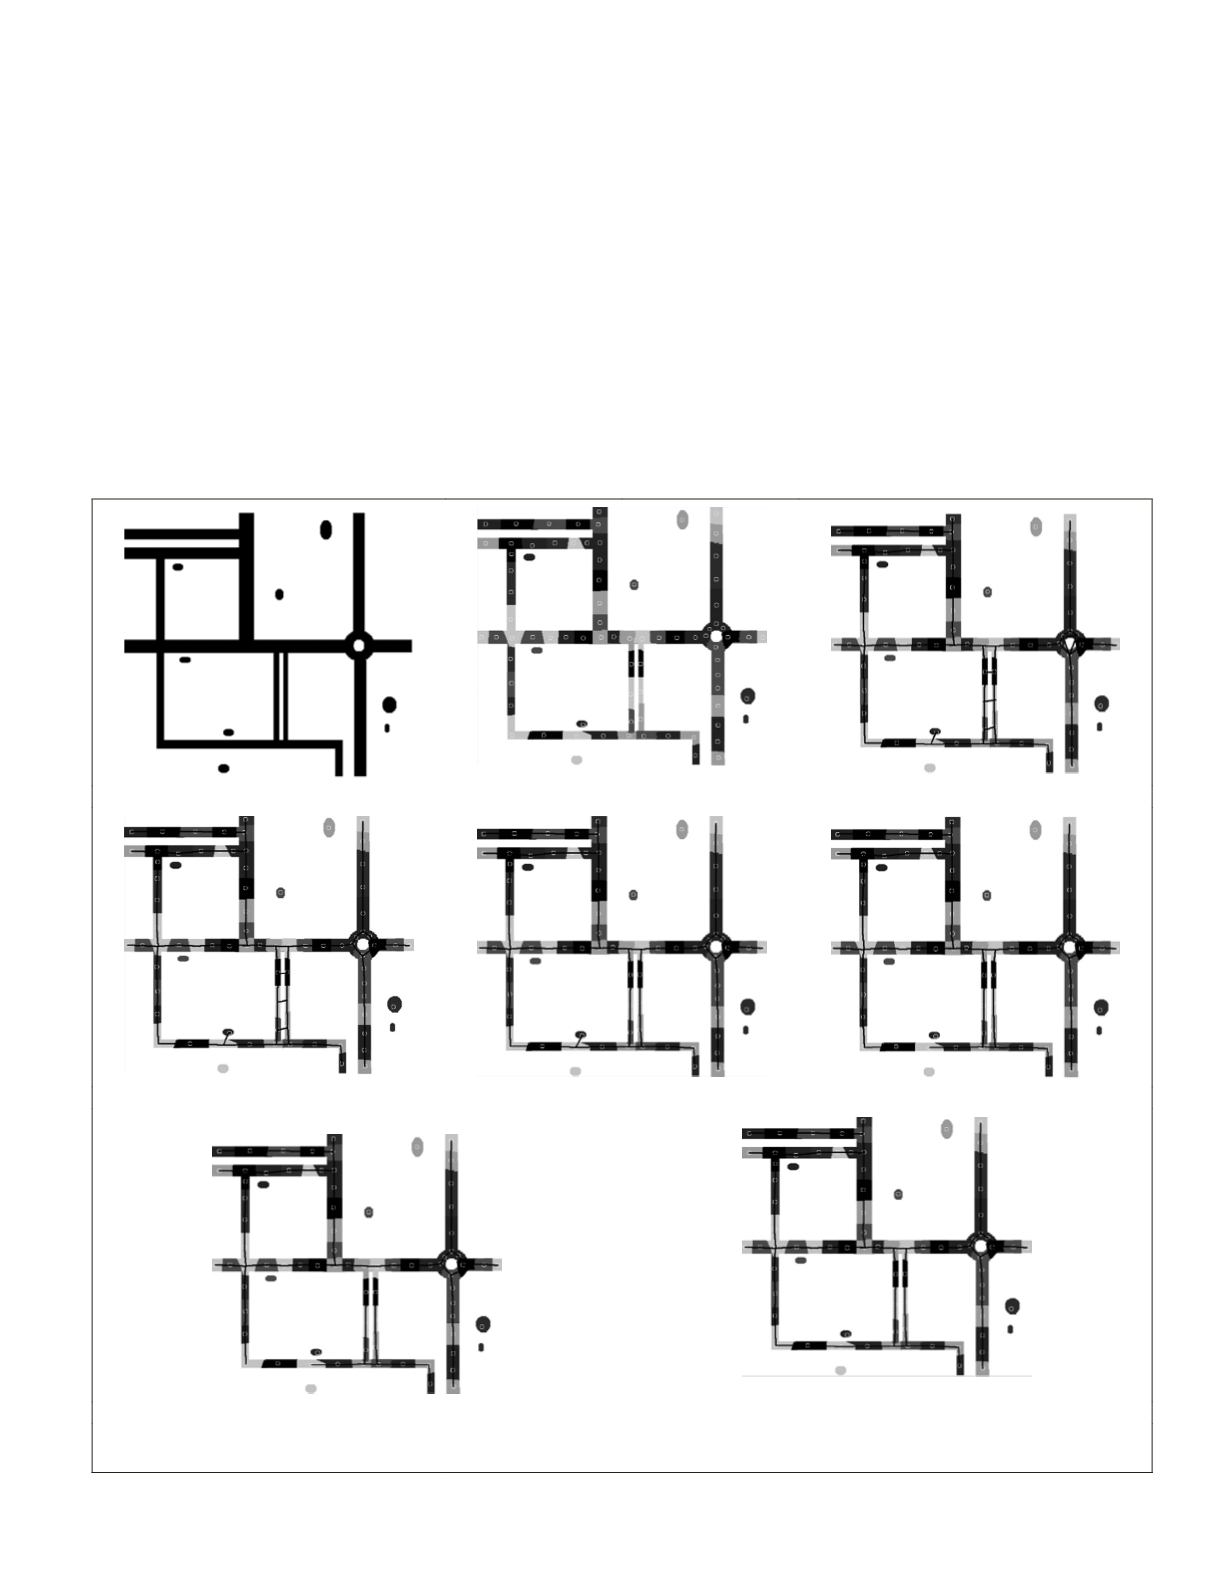
In order to evaluate the performance of the proposed algo-
rithm, a simulated road binary image (Figure 8a) is generated
which contains roads with different widths, parallel roads
with different distances, and some three and four-leg inter-
sections. In addition, several non-road objects are added to
simulate a real detected road image. Results of determining
optimized road patches and their corresponding road key
points by means of
DRPCPSO
algorithm is demonstrated in Fig-
ure 8b. In this figure, road patches are depicted in grayscale.
To correctly determine the appropriate decision strategy, the
proposed road key point connection methodology was imple-
mented on the simulated road image regarding different OR-
ness values. The results are depicted in Figure 8c through 8g.
In the case of lower ORness values, there are some falsely
extracted road segments (see Figure 8c through 8e) which
indicate reduction in the cost values. Therefore, more line
segments are accepted as road segment by the proposed
algorithm. Alternatively, selecting higher ORness values leads
to increase in the cost value raising the missed road seg-
ments (see Figure 8f and 8g). The cost of each line segment
was finally calculated using Equation 1) by substituting the
average of
OWA
values obtained by selecting different decision
strategies. As depicted in Figure 8h the most complete road
network is obtained using average
OWA
value. The isolated
road key points in Figure 8h are not connected to the road
(a)
(b)
(c)
(d)
(e)
(f)
(g)
(h)
Figure 8. Results with the simulated image: (a) original image, (b) Road key points determination using DRPCPSO, (c) to (g) the proposed
road key point connection using ORness of 0, 0.3, 0.5,0.7, and 1, respectively, (h) the proposed algorithm using average OWA value.
PHOTOGRAMMETRIC ENGINEERING & REMOTE SENSING
February 2016
113


