regional adaptive marker-based watershed segmentation algo-
rithm is used to obtain the objects of the overlapping area in
the left image. Then, the overlapping area of the right image is
overlaid with the objects’ boundaries of the overlapping area
of the left image. Second, the correlation coefficient is used
to estimate the degree of the objects’ differences between the
left image and the right image. The region adjacency matrix
(a detailed definition is shown in Equation 5) is built in the
correlation coefficient object map. A connectivity analysis
algorithm with minimized maximum difference is used to
determine the preferred objects areas (hereafter referred to
as
POA
s). The
POA
s are areas through which it is preferred
that the seamlines pass. Finally, pixel-level optimization is
performed using Dijkstra’s shortest-path searching algorithm
to find the final seamlines (Fredman and Tarjan, 1987; Cher-
kassky
et al.
, 1996; Cormen
et al.
, 2001; Chen
et al.
, 2007).
This work has several significant improvements and exten-
sions in contrast to the publication of Pan (Pan
et al.
, 2014b)
on this topic:
1. A regional adaptive marker-based watershed segmen-
tation is used to obtain the objects of the overlapping
area, which improves the efficiency.
2. A one-to-one correlation between the left image and the
right image is established by overlaying the overlapping
area of the right image with the objects’ boundaries of
the left image to estimate the difference based on objects.
3. A connectivity analysis algorithm with minimized
maximum difference is used to determine the
POA
s,
which we call a seamline determination at the object
level in this paper.
4. Dijkstra’s shortest-path searching algorithm with a
binary min-heap is used to improve the efficiency of
Dijkstra’s shortest-path searching algorithm.
Data Preparation
Two Data Sets of digital color aerial orthoimages were used
to test the proposed algorithm in this study. All images were
provided by the Heilongjiang Institute of Geomatics Engi-
neering and Seasky Geomatics Technologies, Inc., China.
The ground resolution of Data Set 1 is 0.5 m and the overlap-
ping area size is 3,030 pixels by 2,067 pixels, which covers a
downtown area of a big city with a large number of high-rise
buildings. The ground resolution of Data Set 2 is 0.2 m and
the overlapping area size is 2,438 pixels by 4,824 pixels, cov-
ering the suburban district.
Methodology
To minimize visual discontinuities, the seamline should
avoid crossing obvious objects, e.g., buildings and high bridg-
es. Relief displacement mainly occurs because a
DTM
does not
contain elevations for these obvious objects. A differential
expression is used to evaluate the difference of the overlap-
ping area between the left and right images. A differential ex-
pression is a major difficulty in seamline determination. The
differential expression generally uses a cost matrix to store
the difference of the overlapping area. Common differential
expression methods based on pixels and local regular sub-
images cannot evaluate the difference exactly. If object-based
recognition were performed, the differential expression would
be improved. The seamlines can be guaranteed to avoid cross-
ing objects such as buildings and high bridges by setting the
areas of those stand-alone objects to the highest difference.
However, object-based recognition is a very difficult task.
Therefore, the proposed algorithm adopts the segmentation
algorithm to improve the differential expression.
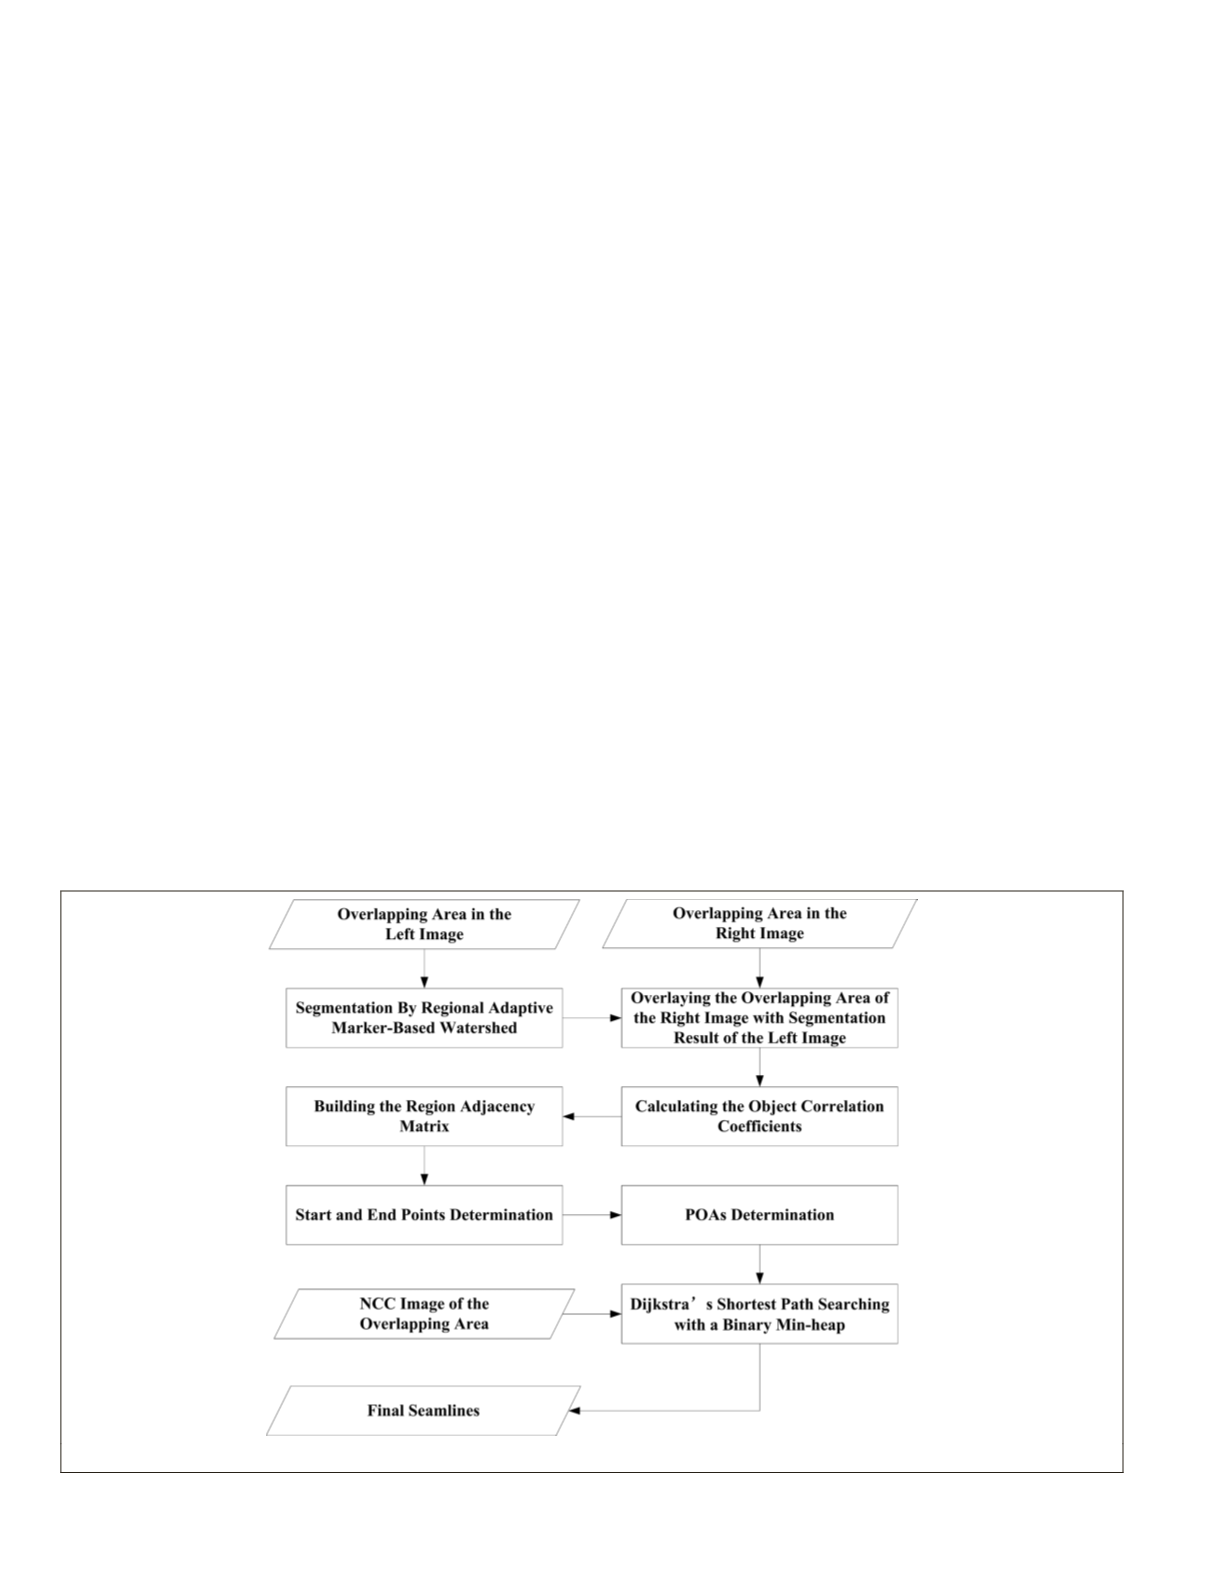
Figure 1 shows the flowchart of the proposed method.
Seamlines are extracted through a three-step operation: (a)
segmentation by regional adaptive marker-based watershed;
(b) seamline determination at the object level; and (c) seam-
line determination at the pixel level. Specifically, the second
step includes three sub-operations: calculating the object cor-
relation coefficients, building the region adjacency matrix and
POA
s determination. In addition, if the left and right image
are in the
RGB
color space, our method will transfer them into
Figure 1. The flowchart of the proposed seamline determination method.
122
February 2016
PHOTOGRAMMETRIC ENGINEERING & REMOTE SENSING


