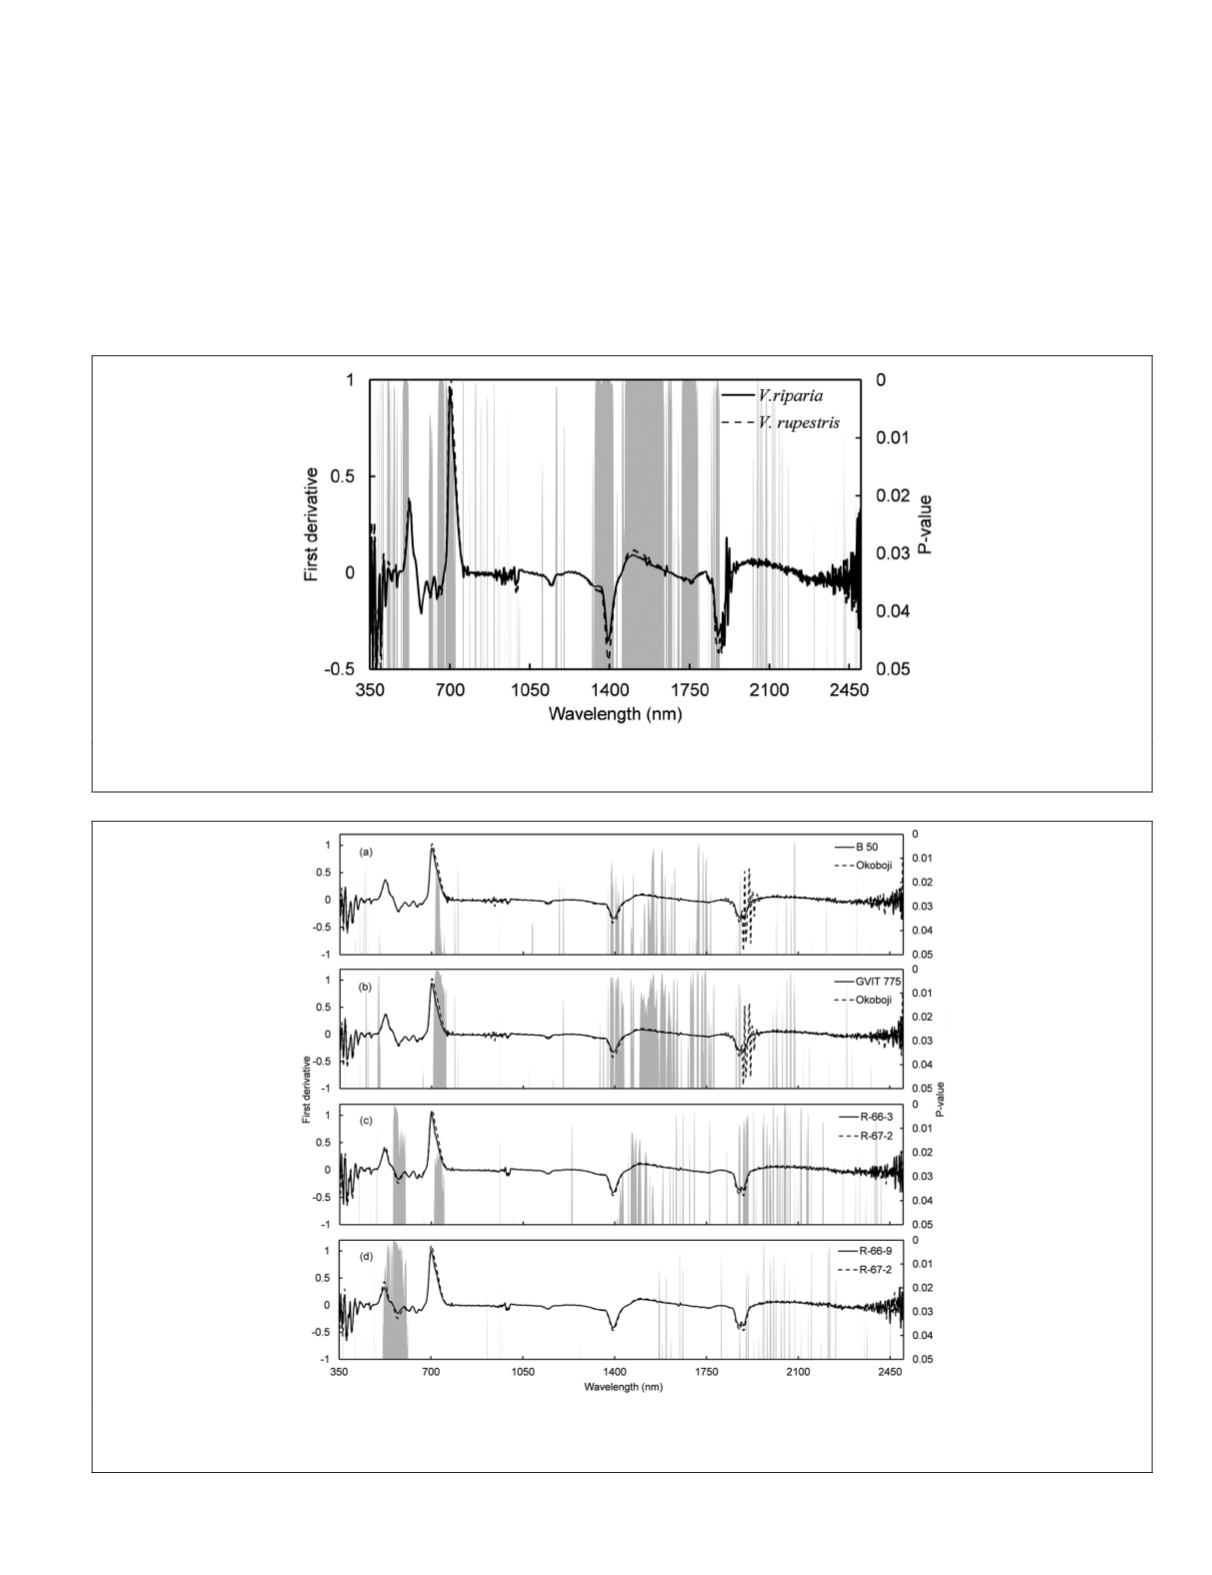
identified in the reflectance factor analysis (Figure 1). How-
ever, the spectral regions where genotypes were statistically
separable were not the same in the 1
st
-d data and the original
raw reflectance factor data (Figure 4). Specifically, the 710-
750 nm (
p
<0.05) and the 705 - 755 nm (
p
<0.03) regions were
found as spectrally separable for the B 50 and Okoboji and
GVIT 775 and Okoboji groups, respectively, within
V. riparia
species (Figure 4a and 4b). Similarly, within
V. rupestris
spe-
cies R-66-3 and R-67-2 group was separable in the 550-600
nm (
p
<0.02) and 710-750 nm (
p
<0.04) regions (Figure 4c),
and the R-66-9 and R-67-2 group was separable in 510-612
nm (
p
<0.02) region (Figure 4d). In all cases above, the 1
st
-d
was capable of finding variably spaced spectral signatures
throughout the
VIS
,
NIR
, and
SWIR
regions.
We also calculated the 2
nd
derivative (2
nd
-d) of the leaf re-
flectance factor spectra and found several spectrally separable
regions. In this study, we only present the 2
nd
-d results at
VIS
spectral range (400-750 nm) because these are the spectral re-
gions where the influence of chlorophyll-a and b carotenoids
is predominant. Between
V. riparia
and
V. rupestris
, spectrally
separable bands are sparsely distributed over the
VIS
wave-
length range and are primarily centered in the 650-700 nm
(
p
<0.02) region (Figure 5a). Among genotype comparison
groups, similar trends were detected. The most obvious group
Figure 3. Mean 1
st
-d leaf reflectance factor spectra of
V. riparia
and
V. rupestris
, with band-by-band t-tests showing significant differences
in grey bars (p-values≤0.05).
Figure 4. Mean 1
st
-d leaf reflectance factor spectra of (a) B 50 and Okoboji within
V. riparia
, (b) GVIT 775 and Okoboji within
V. riparia
, (c)
R-66-3 and R-67-2 within
V. rupestris
, and
(d), R-66-9 and R-67-2 within
V. rupestris
, with band-by-band t-tests showing significant differ-
ences in grey bars (p-values≤0.05).
PHOTOGRAMMETRIC ENGINEERING & REMOTE SENSING
January 2016
55


