indicated that there was a significant difference only in s
PRI
values (
F
4, 24
= 15.52,
p
<0.01). Based on a Bonferroni adjusted
t-test, we determined that two pairs of
V. rupestris
genotypes,
B 38 and R-66-3 (t = 5.24,
p
<0.01) and R-67-2 and R-66-3 (t =
4.71,
p
<0.01), could be differentiated using s
PRI
.
Separability Analysis Based on Simulated EO-1 Hyperion Indices
The results of
ANOVA
performed on simulated Hyperion indi-
ces, did not show significant differences for total chlorophyll
content between two species (
F
1, 59
= 3.60,
p
= 0.06).
V. riparia
had higher total chlorophyll content than its counterpart, and
this is consistent with the results found at leaf and canopy
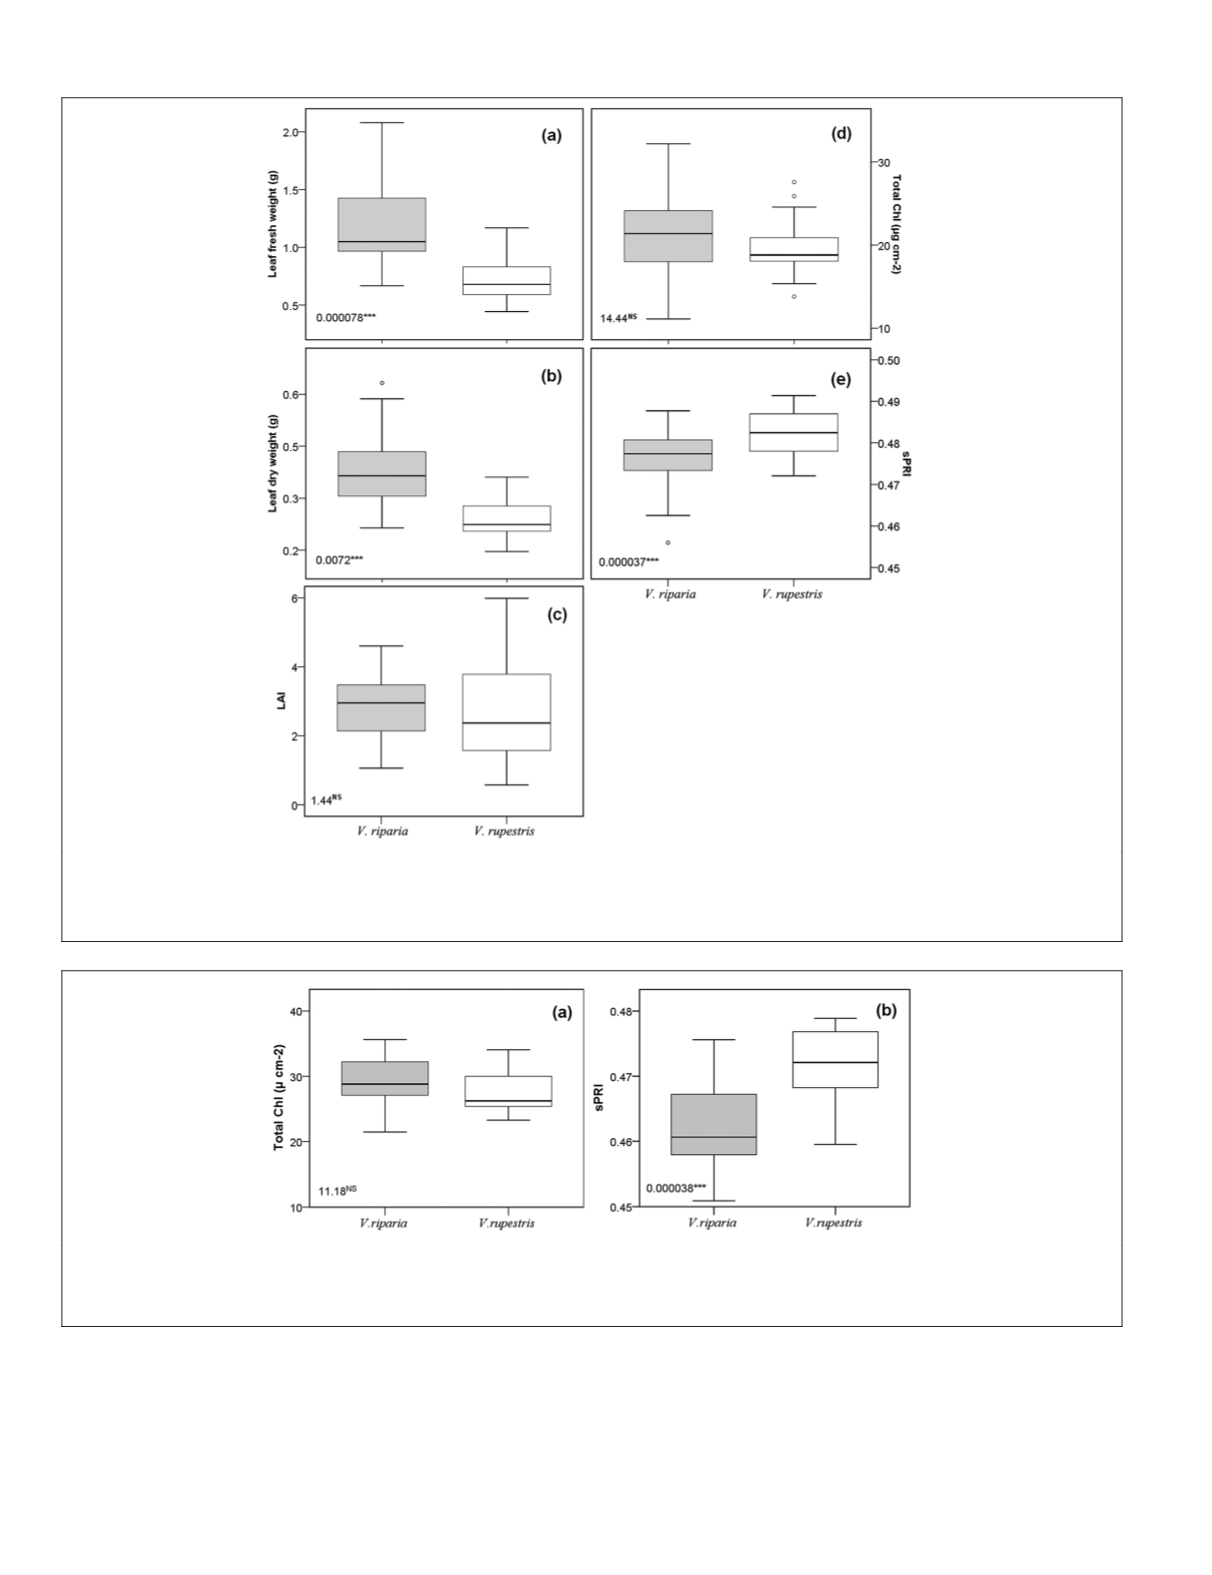
Figure 10. Variation in foliar properties of grapevine species and genotypes within the species: (a) leaf fresh weight, (b) leaf dry weight,
(c) LAI, (d) total chlorophyll content, and (e) scaled photochemical reflectance index. Dots outside of the box plots represent outliers and
whiskers indicate the 5
th
and 95
th
percentiles. Solid lines inside the box represent the median; the colored area represents the 25
th
and
75
th
percentile. The mean square error (MSE) from the ANOVA and level of significance is also shown (***p < 0.01).
Figure 11. Variation in foliar properties of grapevine species and genotypes within the species: (a) total chlorophyll content, and (b)
scaled photochemical reflectance index. Whiskers indicate the 5
th
and 95
th
percentiles. Solid lines inside the box represent the median;
the colored area represents the 25
th
and 75
th
percentile. The mean square error (MSE) from the ANOVA and level of significance is also
shown. ***p < 0.01
58
January 2016
PHOTOGRAMMETRIC ENGINEERING & REMOTE SENSING


