where
ρ
Hyperion
is simulated EO-1 Hyperion reflectance factor
spectra of band
λ
;
f
(
λ
) is the spectral response function of the
simulated band
λ
;
ρ
leaf
(
λ
) is the measured reflectance factor at
band
λ
; and
λ
min
and
λ
max
are the lower and upper bounds of leaf
spectra. We calculated the s
PRI
and
CI
indices using 528.7 nm,
569.4 nm, 701.6 nm, and 752.47 nm spectral bands of simulated
EO-1 Hyperion data based on Equations 1 and 3, respectively.
Foliar Statistical Analysis
Initially, we tested for differences between nine genotypes of
V.
riparia
and
V. rupestris
in five leaf, structural, bio- and photo-
chemical properties including fresh, dry leaf weight,
LAI
, total
chlorophyll content and s
PRI
. Three steps were taken to evaluate
the potential leaf traits to discriminate between species. First,
between species, a one-way analysis of variance (
ANOVA
) was
used to examine whether differences exist between genotype
means of species. Secondly, within species, one-way
ANOVA
was
conducted in separate species to compare the leaf traits within
four genotypes of
V. riparia
and five genotypes of
V. rupestris
,
respectively. Finally, a multiple comparisons test using Bonfer-
roni adjusted t-test, which can reduce the chance of committing
Type I error, was carried out in order to determine which pairs
of genotype means differ (Zar, 1996). We applied the Bonferroni
multiple comparisons procedure with α = 0.05 to the data. The
alpha level was adjusted downwards by dividing 0.05 by four
(number of
V. riparia
genotypes) and five (number of
V. rupestris
genotypes), e.g., 0.05/4 = 0.0125 and 0.05/5= 0.01.
Results
Leaf Reflectance Factor Spectra Separability
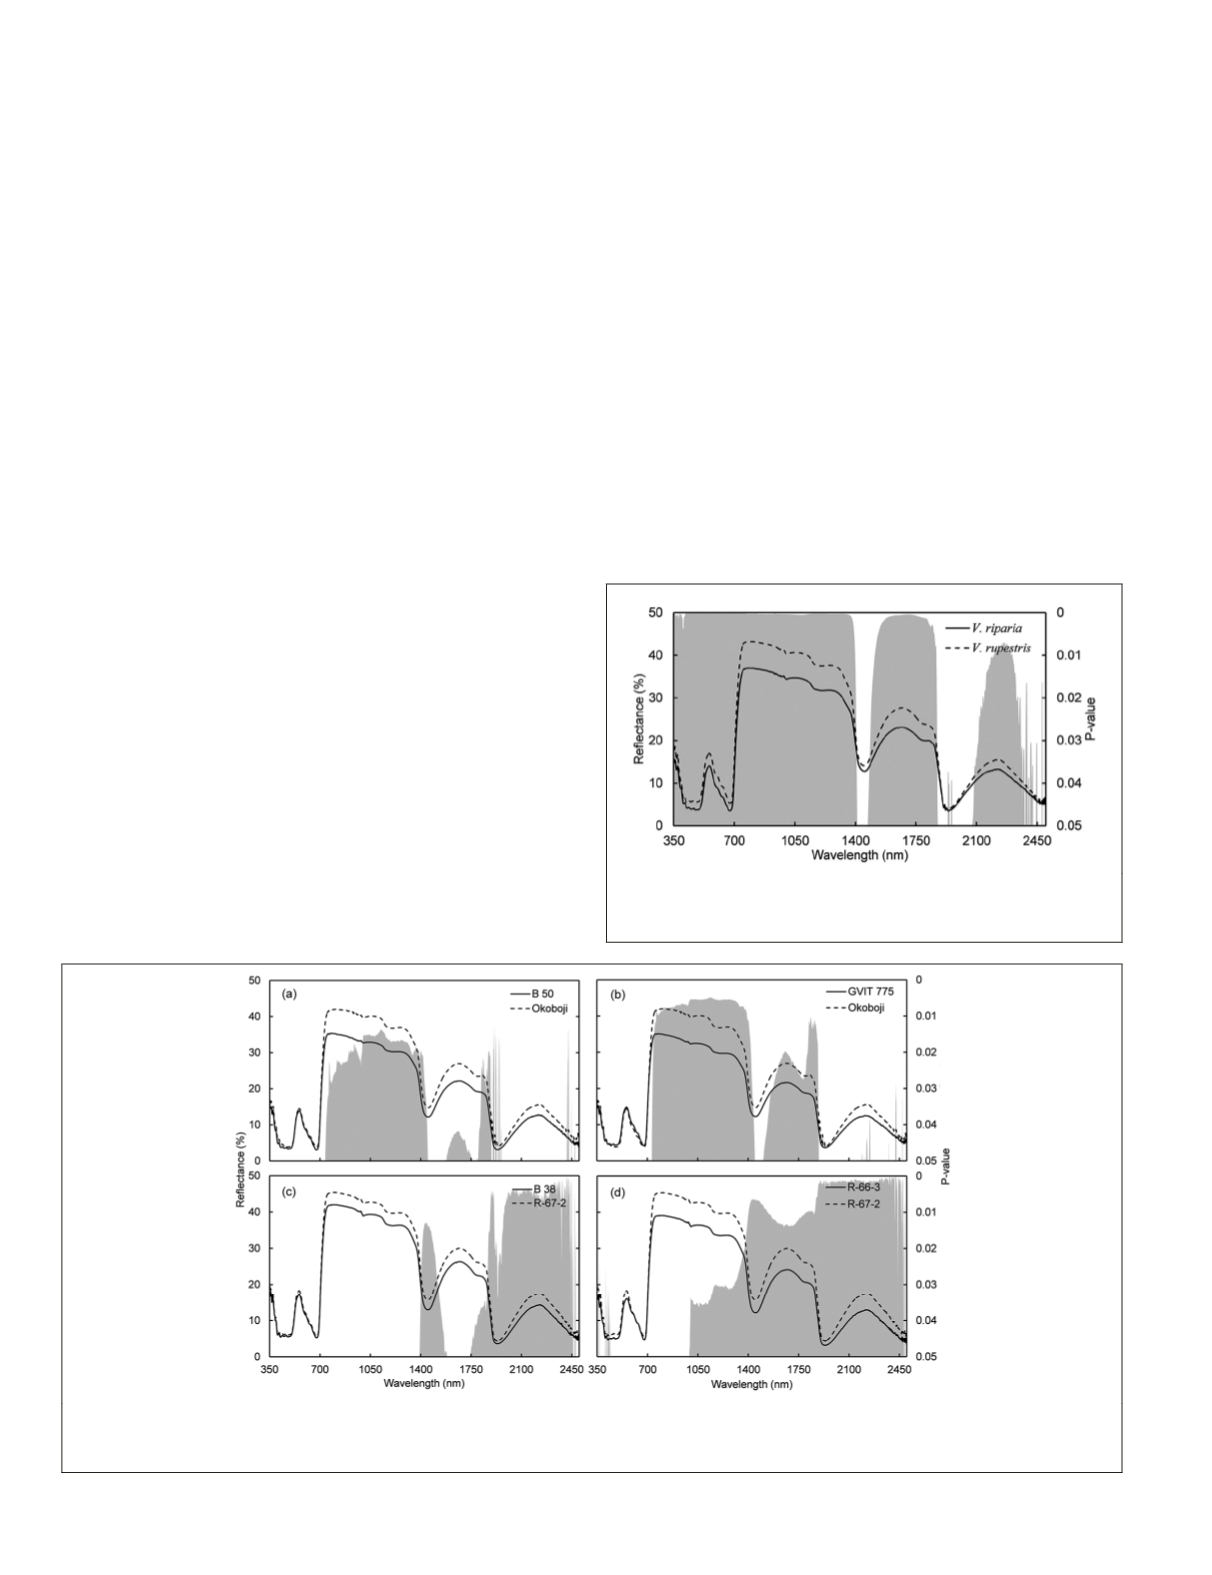
Figure 1 shows the mean leaf reflectance factor spectra of
V.
riparia
and
V. rupestris
. It was obvious from visual inspection
that
V. rupestris
had higher reflectance factor values in almost
all the wavelength regions (350-2500 nm). To show the con-
sistency of the reflectance factor differences and confirm they
were not detected by chance, we employed an independent
t-test to investigate the spectral separability through band-by-
band comparison. The results indicated that spectral differ-
ences between
V. riparia
and
V. rupestris
were statistically
significant across three wavelength regions: 350-1400 nm (
p
<0.01), 1480-1870 (
p
<0.01), and 2100-2400 nm (
p
<0.04).
We also tested the leaf spectral separability between sub-
species by examining four genotypes within
V. riparia
and five
genotypes within
V. rupestris
species (Figure 2). Over the full
spectral region, we identified wavelength-specific differences
between the Okoboji and both B 50 and
GVIT
775 subspecies
within
V. riparia
, and between R-67-2 and both B 38 and, R-66-
3 subspecies within
V. rupestris
. Within
V. riparia
, a spectrally
separable continuous region (730-1450 nm) (
p
<0.03) and some
discontinuous
SWIR
regions were detected between B 50 and
Okoboji leaf spectra (Figure 2a). Similar results were found
when comparing GVIT 775 and Okoboji genotypes, but there
were more wavelength-specific differences in the
SWIR
region,
and they were consistent than found in the B 50 and Okoboji
group (Figure 2b). Within
V. rupestris
, two wavelength regions,
1390-1585 nm and 1740-2470 nm (
p
<0.04), showed statisti-
cally significant difference for B 38 and R-67-2 genotype group
(Figure 2c). Moreover, R-66-3 and R-67-2 spectra were spec-
trally separable in the 990-2500 nm (
p
<0.04), and there were
some subtle spectral separability in the
VIS
region (Figure 2d).
Figure 3 shows the 1
st
derivative (1
st
-d) of the leaf reflec-
tance factor spectra between the
V. riparia
and
V. rupestris
.
The number of bands significant for discrimination derived
from 1
st
-d transform were much fewer compared to those
Figure 1. Mean leaf reflectance factor spectra of
V. riparia
and
V.
rupestris
with band-by-band t-tests showing significant differ-
ences in grey bars (
p
-values ≤0.05).
Figure 2. Mean leaf reflectance factor spectra of (a) B 50 and Okoboji within
V. riparia
, (b) GVIT 775 and Okoboji within
V. riparia
, (c), B
38 and R-67-2 within
V. rupestris
,
(d) R-66-3 and R-67-2 within
V. rupestris
, and
(e) with band-by-band t-tests showing significant differ-
ences in grey bars (p-values≤ 0.05).
54
January 2016
PHOTOGRAMMETRIC ENGINEERING & REMOTE SENSING


