Regarding the percentiles of
ALS
metrics (Figure 3), lower
percentiles (approximately, from 20
th
to 40
th
) were more
influenced by the definition of
MinH
than higher percentiles
(upper than the median, approximately). This tendency was
observed whether all returns or first only were used. There-
fore, as it was expected, higher percentiles were more robust
to changes in the reference height threshold. Among all the
metrics tested, the 99
th
percentile (P99) obtained the high-
est
MIC
= 0.915, and it was therefore the one having more
explanatory potential for stand volume.
Generally speaking, density metrics (canopy cover, Figure
2) had an opposite response to the use of reference height
thresholds than those explained for
ALS
height metrics. First,
the strength of their relation with stand volume often de-
creased for increasing reference height thresholds. Second,
relative proportions computed from first returns (PROP#f,
PROP.MEANf, PROP.MODf) were seemly more influenced
than those using all returns. The density metrics were divided
into two groups: one group in which the reference height
defined the fixed
HBreak
(left); whereas for the other group
HBreak
was variable (right). Metrics in the latter group were
ultimately influenced by
MinH
, since that was a param-
eter modifying mean or mode (the variable
HBreak
). Fixing
HBreak
= 0 or
MinH
= 0, which would essentially evaluate the
amount of visible ground from a nadir viewpoint, obtained
the density metrics most strongly related to stand volume.
The highest value of was obtained for the ratio between all
the returns above
HBreak
= 0 and all the first returns. Other-
wise, density metrics showed the weakest relations to stand
volume amongst all the metrics studied, reaching values as
low as
MIC
= 0.275.
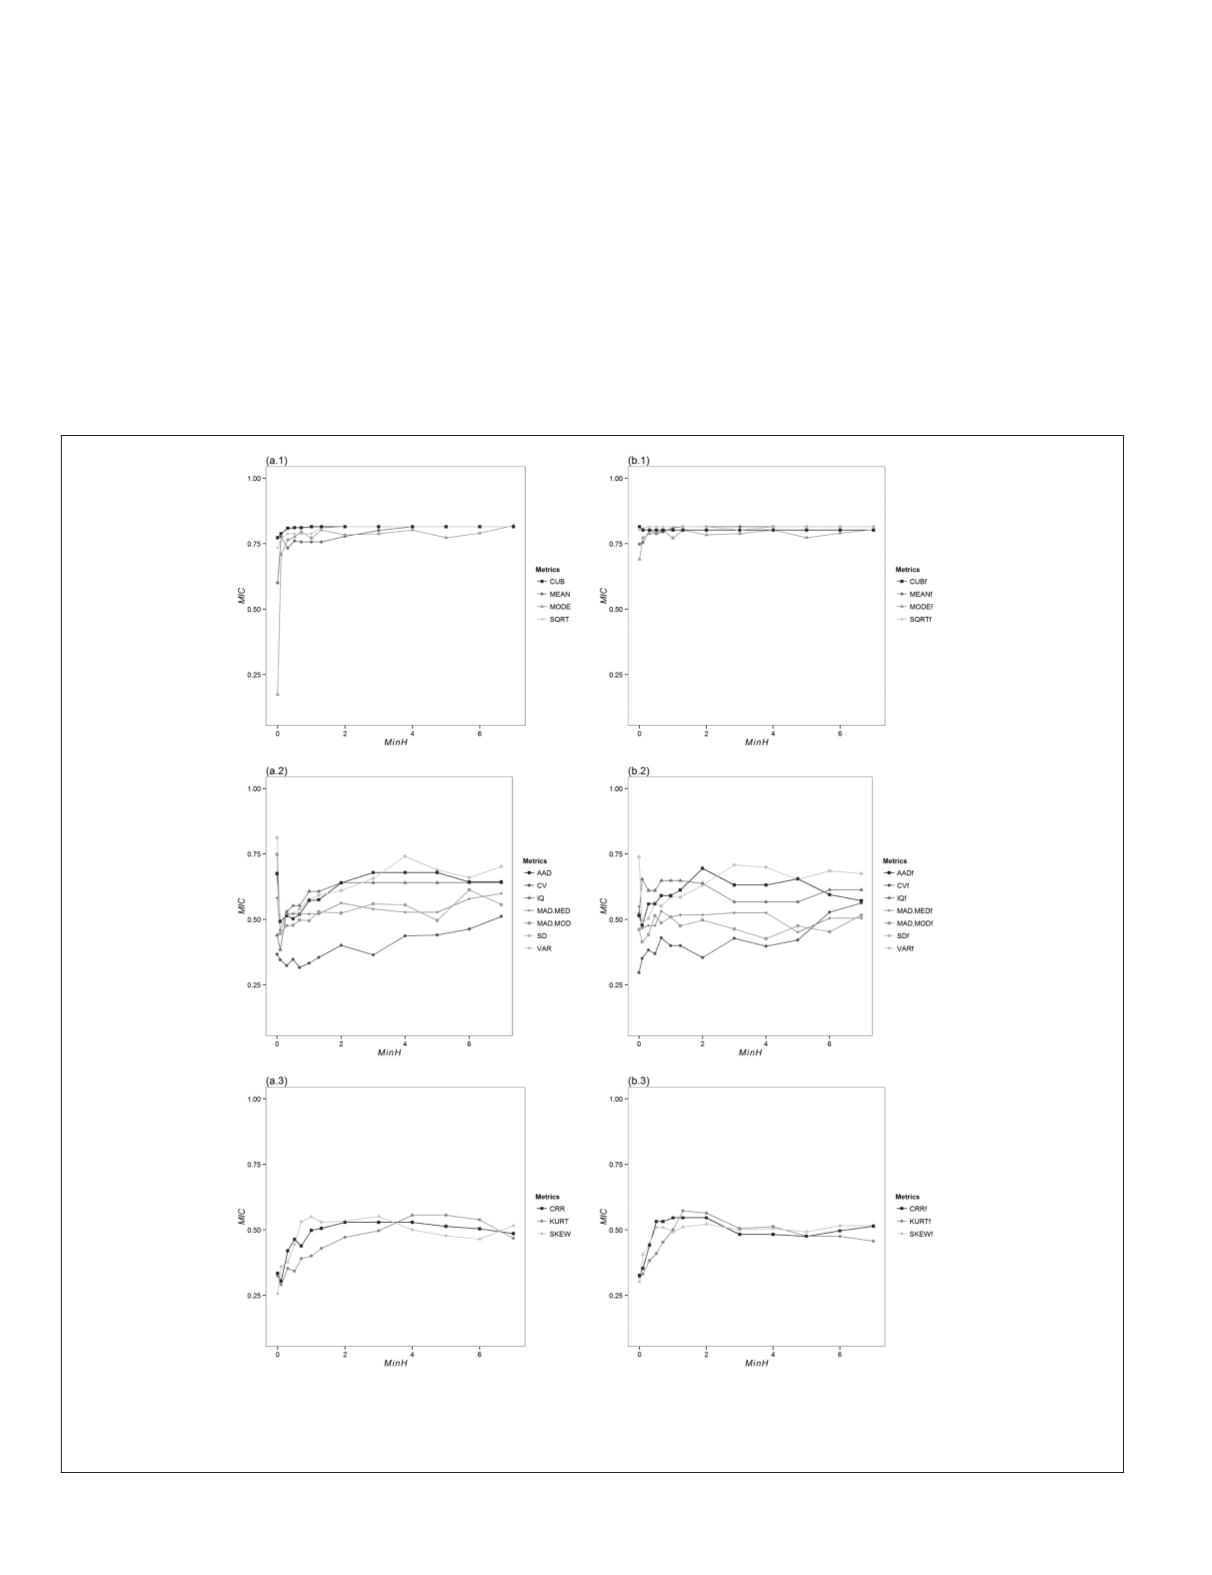
Figure 1. Maximal Information Coefficient (
MIC
) of the height metrics by increasing reference height (minimum height,
MinH
). By column, they are grouped into those computed from (a) all returns or (b) first returns only. By row, they are
grouped following Table 2, i.e., into metrics denoting a measure of ALS return heights distribution’s (1) central tendency, (2)
dispersion, or (3) shape. See Table 2 for metric definitions.
346
May 2017
PHOTOGRAMMETRIC ENGINEERING & REMOTE SENSING


