It triggered thousands of deaths
and caused enormous damage to
construction, transportation, and
communication networks. Mas-
sive landslides took place after
the earthquake, and several vil-
lages were isolated from rescue
operations. A fast and accurate
mapping of landslide would
have been significantly helpful
for rescue and rescue operation
to minimize human losses. Ac-
cording to the landslide distribu-
tion, manually drawn by the staff
at Durham University and the
British Geological Survey (Bot,
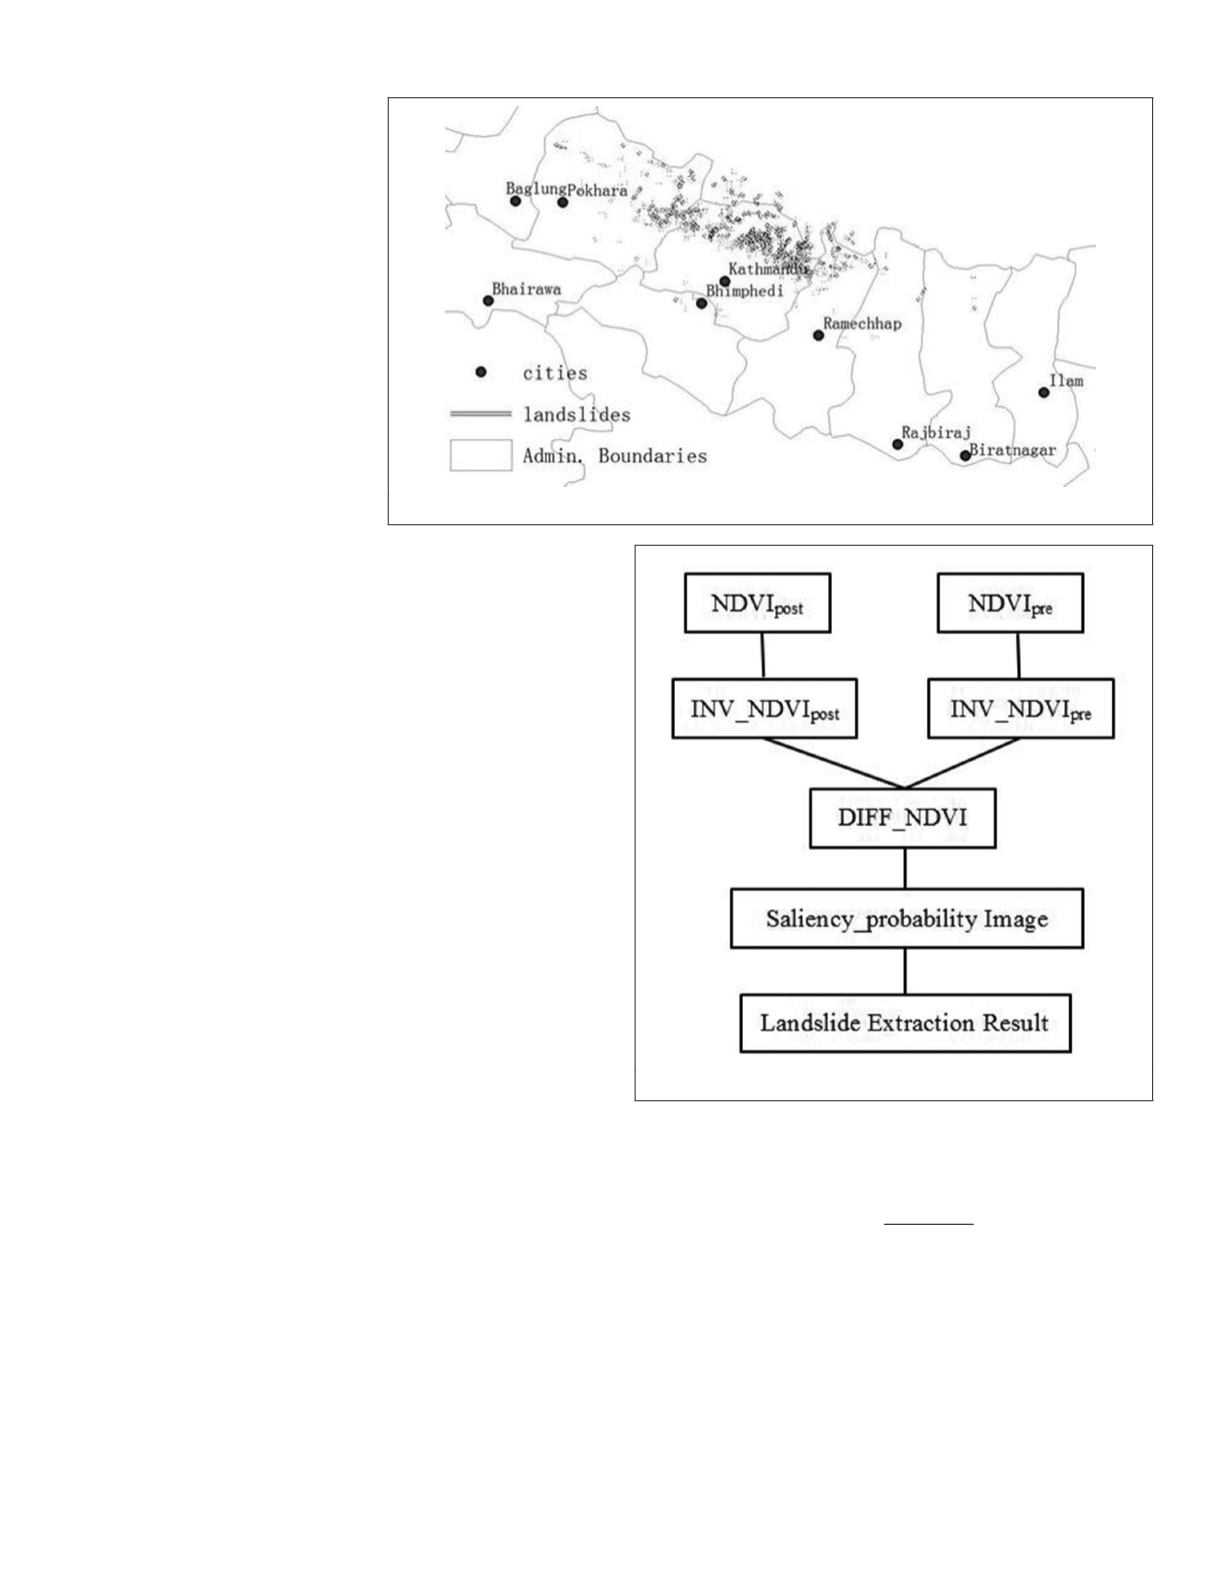
2015) in Figure 3, we selected six
research regions, marked as A,
B, C, D, E, and F in Figure 1. The
research regions are all located
next to Himalayas bordering area,
in the north of Pokhara, Kath-
mandu and Ramechhap, which
were significantly impacted by the landslides (NASA, 2015).
Compared with the first study area, Shenzhen is a highly ur-
banized city in China. The landslides in Shenzhen have a more
complicated background, with many bare rocks and human
construction. The robustness and efficiency of landslide detec-
tion algorithm can be better evaluated on such research area. On
20 December 2015, several landslides occurred in Shenzhen and
buried 33 buildings with 59 people with no contact. According
to the visual interpretation, we selected four research regions
with landslides and marked them as I, J, M, and N in Figure 2.
Landsat-8 is the eighth satellite of Landsat program,
launched on 11 February 2013 (N2YO, 2015). Landsat-8 has
eleven bands, covering nine traditional spectral bands and
two thermal infrared bands. Among the traditional spectral
bands, the panchromatic band has a spatial resolution of
15 m, while the other bands are 30 m. Therefore, we fused
the panchromatic band with false color image using Gram-
Schmidt Pan Sharpening method (Laben and Brower, 2000).
The false color image is a combination of bands 5, 4, and 3.
Afterwards, the result was a false color image with a spa-
tial resolution of 15 m. Considering the time of each event,
we selected Landsat-8 data of 13 March 2015 and 01 June
2015 to describe pre-landslide and post-landslide images of
study area One; 18 November 2015 and 07 February 2015 to
describe pre-landslide and post-landslide for study area Two.
The research regions corresponding to the regions marked
with A, B,…, N, in Figure 1 and Figure 2 are shown in gray-
scale in Figure 4 (next page), respectively.
Methods
Faced with the tendency that the number of remote sensed
images is becoming larger with the increasing spatial and
temporal resolution, a fast and reliable method is proposed
in this research. It introduces a concept “saliency” for remote
sensed landslide detection. The general flow chart of our
method is demonstrated in Figure 5, wherein
INV_NDVI
indi-
cates the inverse of
NDVI
.
NDVI Change Detection
Before change detection, we performed radiometric correction
and geometric correction. Radiometric correction is done to
transform the original digital number (
DN
) in the image to radi-
ance. We performed radiometric correction using Landsat Cali-
bration module in ENVI software
.
com/ProductsandSolutions/GeospatialProducts/ENVI.aspx
).
After geometric correction, we calculated
NDVI
index to
enhance the vegetation information for each study region ac-
cording to Equation 1.
NDVI
NIR RED
NIR RED
=
−
+
(1)
where
NIR
represents near infra-red channel, and
RED
is red channel.
Since our target is to detect landslide, which belongs to
non-vegetation, we inverse the
NDVI
by Equation 2.
INV_NDVI
= 1 –
NDVI
(2)
In this way, change detection of
INV_NDVI
between pre- and
post-study region images can enhance non-vegetation change,
so that landslide occurrence can be highlighted compared
Figure 3. Ground truth landslide distributions in Nepal.
Figure 5. Flow chart of our method.
PHOTOGRAMMETRIC ENGINEERING & REMOTE SENSING
May 2017
353


