adopts advanced numerical calculation and data assimilation
technology. In particular, the
WRF
model has been extensively
used in simulation theory and the application of the heat
island effect. Accordingly, the
WRF
model is an important me-
soscale numerical model in the study of the heat island effect.
This study simulates the temperature and humidity of
Guangzhou in 2000 and 2009 using the
WRF
meteorological
model, which uses two types of land use type data from vari-
ous times and sources of remote sensing image. The changing
characteristics of the heat island effect in Guangzhou over
time are analyzed as well.
Experimental Design of Simulation
The
WRF
model is used as a research tool to design a four-
nested grid with a Lambert map projection. The horizontal
lattice is 27, 9, 3, and 1 km. The simulation results of the
fourth grid in the main urban area of Guangzhou are analyzed.
The vertical layer has 30 layers and the top of the model is
50 hPa. A set of parameters for the Pearl River Delta region
are summarized by referring to the relevant research on the
numerical simulation of
WRF
in this region. The model uses
the two-moment cloud microphysical scheme (
WRF
Double-
Moment 6-Class,
WDM
6),
Monin–Obukhov surface layer parameterization scheme,
Noah L and Surface Model, and
YSU
planetary boundary layer
scheme. The Kain-Fritsch cumulus scheme is employed in
the simulation regions D01 and D02. No cumulus convection
parameterization scheme is used in the simulation regions
D03 and D04, because the grid can’t distinguish cloud-scale
physical quantities. The initial and boundary conditions are
provided by 1° × 1°
FNL
reanalysis
data every 6 h and interpolated into
the simulation area.
In addition, two simulated tests
are set up in January and July. The
simulation time in January was
from 30 December 2009 at 00:00
(universal time coordinated (
UTC
))
to 01 February, 2010 at 00:00,
whereas that in July was from 29
June, 2010 at 00:00 to 01 August at
00:00, which is two days before the
starting time (spin up). The January
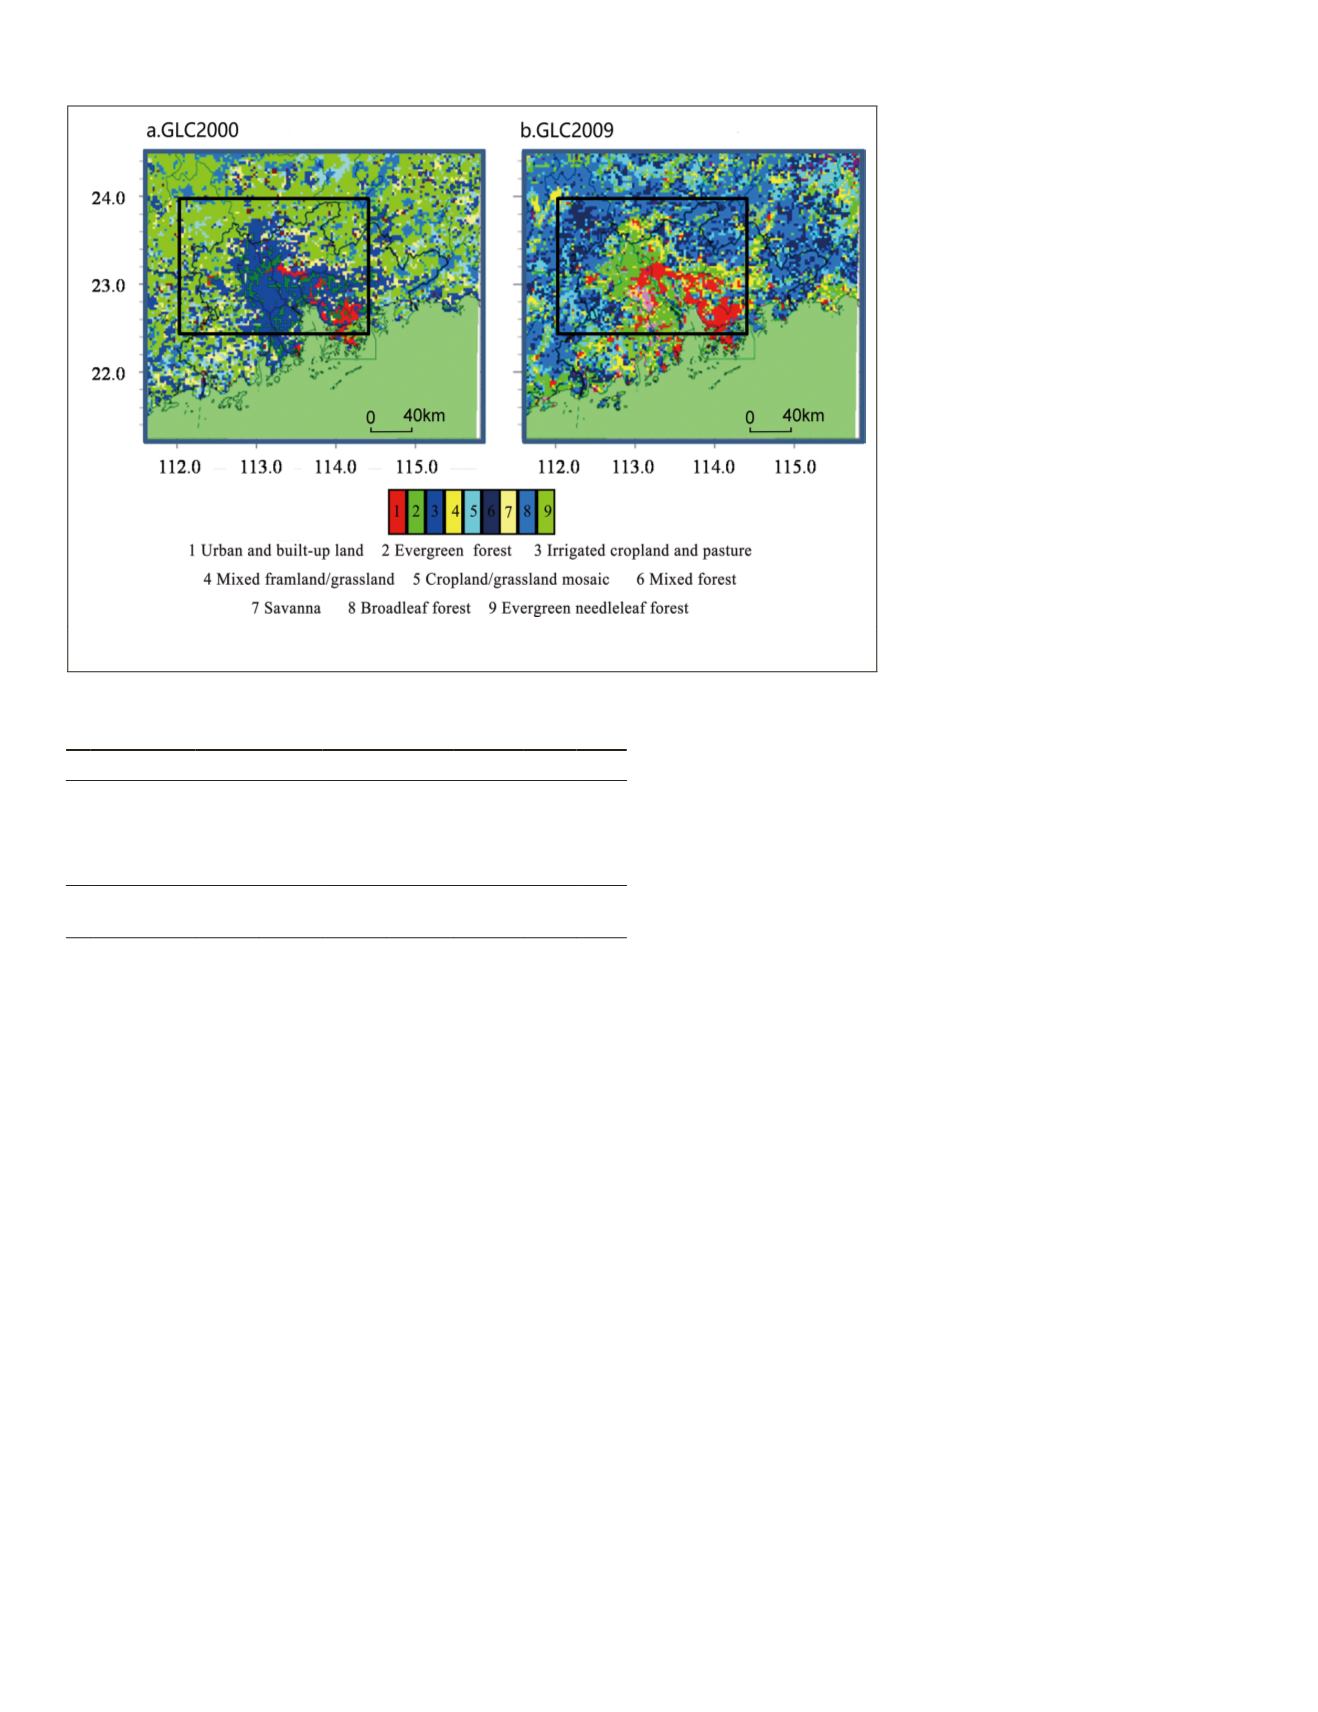
and July control (GLC2009) and
sensitivity tests (GLC2000) used
the same physical parameters and
initial and boundary conditions,
in which the only difference is the
underlying surface type data. The
two sets of underlying surface type
data used in the control and sensi-
tivity tests, which are represented
as GLC2009 and GLC2000 for 2009
and 2000, respectively, are shown
in Figure 3.
Model Validation
The observation data of the Guang-
zhou, Dongguan, and Gaoyao sites
were selected to test the accuracy of the simulated meteoro-
logical field. The main test elements included 2 m tempera-
ture, 2 m relative humidity, and 10 m wind speed. Table 1
shows the results of the 2 m temperatures (T2), 2 m relative
humidity (Rh2), and 10 m wind speed (WS10) simulated
using GLC2009 in January and July (i.e.,
OBS
is the observed
average,
SIM
is the simulated average,
MB
is the mean devia-
tion,
MAE
is the average absolute error,
RMSE
is the root mean
square error, R is the correlation coefficient, and
IOA
is the
compliance index). The relative humidity, temperature, and
wind speed
IOA
are above 0.88 in January and July, and the
temperature and humidity
IOA
even reached 0.99 (see Table
1). The simulated result is considerably accurate in January
and the correlation coefficient is over 0.8. The simulation
result in July is not as good as that in January, although the
correlation coefficient is above 0.66. In general, the simula-
tion results can considerably reflect the actual situation of the
atmosphere.
Estimation of the Nuclear Density
The sizes of various buildings in different radius ranges
vary with the range of the heat source at the center point. A
limited number of radius factors are considerably few and a
substantially large scale is difficult to add in the calculation of
irrelevant objects, thereby increasing the error. This situation
requires the best radius, that is, the most sensitive scale that
can reflect the building density on the heat island mecha-
nism and range regulation. The nuclear density estimation
method is based on the first law of geography (i.e., everything
is related to everything else, but near things are more related
than distant things). The spatial feature distribution for the
depth characteristics of information mining or regular spatial
distribution characteristics is an accurate tool for analysis and
can be used to assess the size of a building in a specific range
based on the magnitude of the heat island size impact.
The principle of nuclear density estimation method is
based on point P, threshold r, which is the number of infor-
mation of a radius within a circle and divided by the area
of the circle. The nuclear density of general point P can be
expressed as follows:
Table 1. Comparison of the simulated and observed
temperature, relative humidity, and wind speed.
Elements OBS SIM MB MAE RMSE R IOA
January
Rh2 (%) 76.43 73.19 -3.24 6.23 7.49 0.87 0.99
T2 (°C)
14.79 16.45 1.66 2.39 2.84 0.80 0.99
WS10 (m/s) 1.71 2.43 0.72 0.91 1.17 0.60 0.92
Rh2 (%) 74.01 74.96 0.95 6.49 7.71 0.66 0.99
July
T2 (°C)
29.21 29.69 0.48 1.37 1.71 0.75 0.99
WS10 (m/s) 2.12 2.63 0.51 1.31 1.76 0.67 0.88
Figure 3. Spatial distribution of land use types in the Pearl River Delta: (a) GLC2000;
(b) GLC2009
552
September 2018
PHOTOGRAMMETRIC ENGINEERING & REMOTE SENSING


