P
d x x
h
i
n
i
x
nh
K
( )
=
=
∑
1
1
( , )
,
(1)
where
n
represents the number of geographic information con-
tained in the distance scale range, K () denotes the kernel density
function,
d
(
x
,
x
i
) represents the Euclidean distance between two
points, and h denotes the distance threshold, that is, the scale
of the nuclear density estimation method. Several studies have
shown that threshold h has considerable influence on nuclear
density analyses and outcomes. That is, a suitable spatial scale
exists. This scale is extremely useful for analyzing the effect of
building density on the heat island effect at a certain scale.
Results
Impact of Land Use Change on the UHI Effect
The data of the land use type change in Guangzhou City in
2000 and 2009 are used as bases to analyze the changes of the
heat island effect intensity after the land use type change in
the main urban area from two aspects, namely, temperature
and humidity. Such analysis could reflect the heat island ef-
fect intensity.
Temperature Changes
When land use type changes, the geometric, radiological, and
thermodynamic parameters of the surface change the surface
energy balance, thereby resulting in changes in the near-
stratospheric temperatures. The most prominent feature of
urbanization is the urban heat island effect. In this study, the
simulated 2 m temperature (T2) by the
WRF
mode is used to
discuss the effect of urban expansion on the temperature dur-
ing the whole day, daytime, and nighttime.
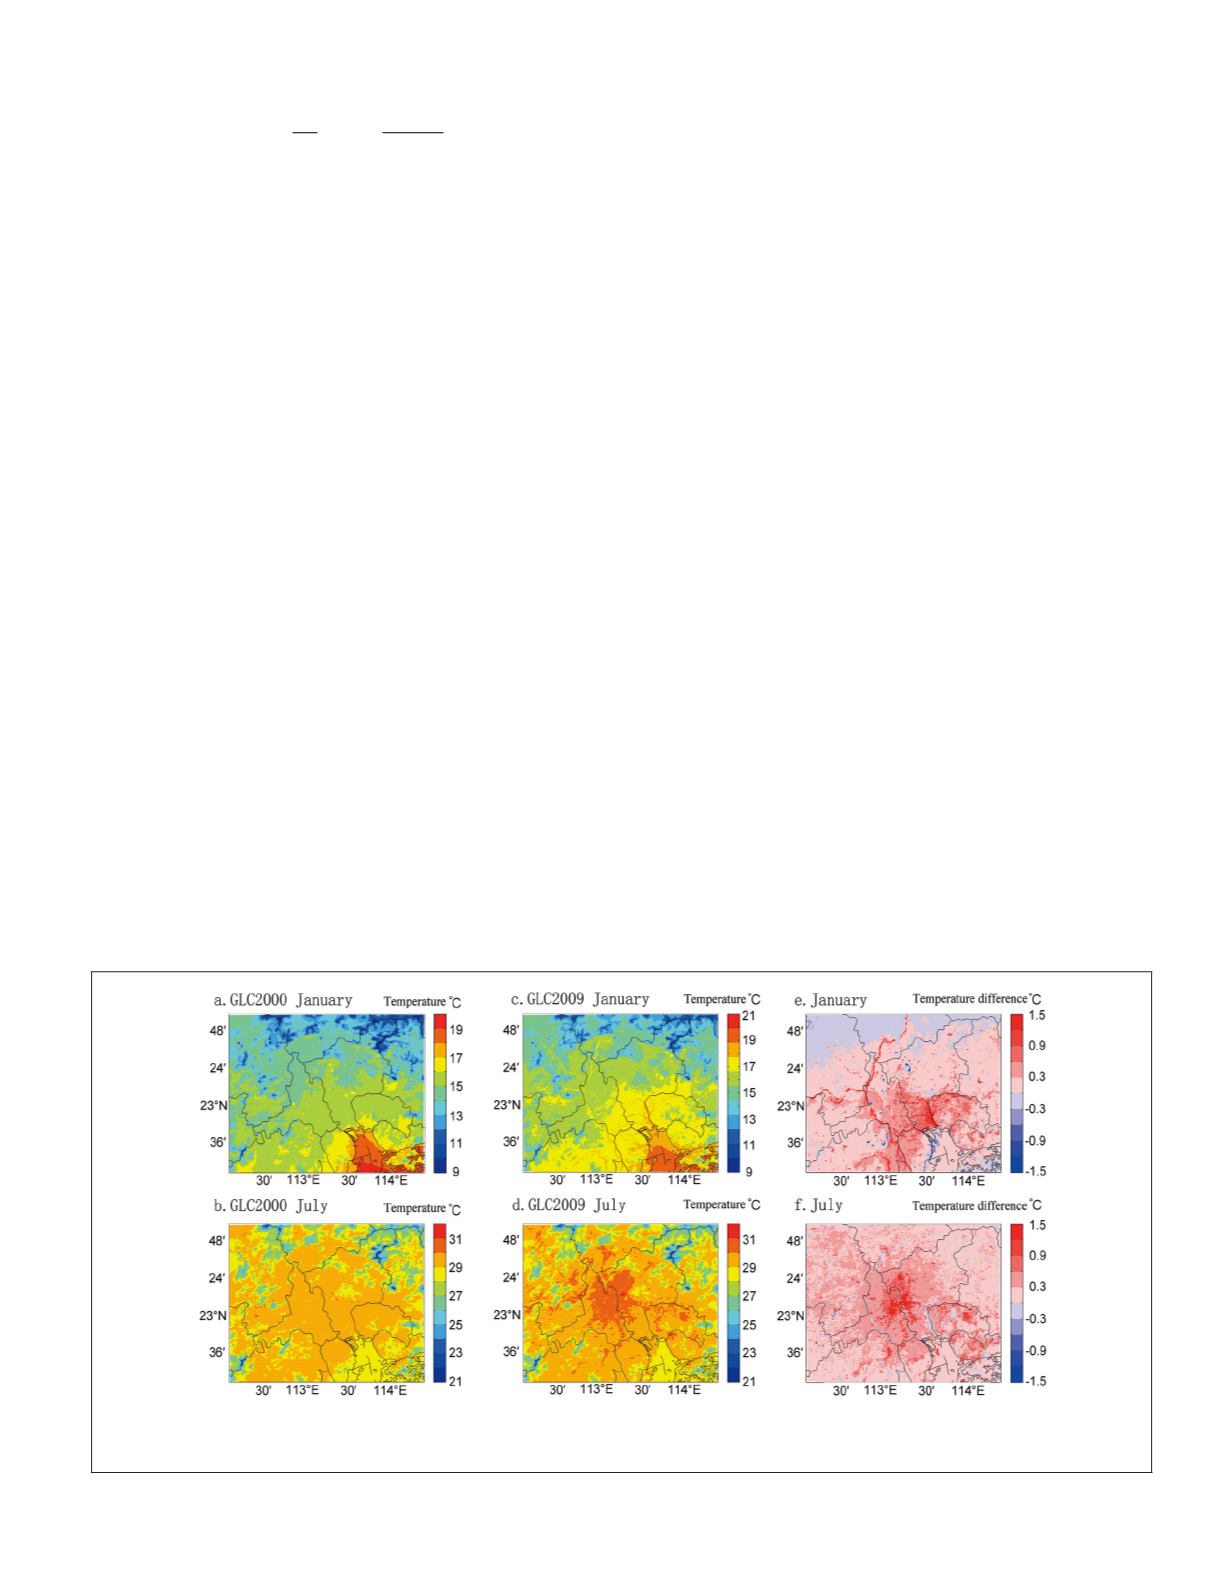
The comparison of the simulated results for the monthly
average temperature in the GLC2000 and GLC2009 cases is
shown in Figure 4. The temperature of the main urban area
in Guangzhou in GLC2000 case is not substantial. Given the
advancement of the urbanization process, the average temper-
ature of the main urban area is substantially higher than those
in the other regions, thereby forming a large-scale
UHI
. The
difference in the 2 m temperature between the two tests can
well reflect the warming effect caused by urban development.
The difference between GLC2000 and GLC2009 cases shows
that the 2 m temperature in the simulated area in January and
July increased under various degrees. The average tempera-
ture increased by 0.20°C in January and 0.31°C in July. In
particular, the Liwan, Yuexiu, and Tianhe districts are the
most evident warming regions that form a substantially high-
temperature peak area.
The warming effect associated with urban development
has an evident diurnal variation before 18 o’clock to reach
the maximum. The maximum temperatures for January and
July are 1°C and 2.2 °C, respectively (see Figure 5). On the one
hand, the warming effect of urban development on the atmo-
sphere is apparent at night because the heat storage capacity
of a city is higher than that in a farmland. The heat stored
during the day will be released at night. On the other hand,
the night boundary layer height is low. The vertical exchange
of heat is weaker at nighttime than daytime. The amount of
heat released from the underlying surface of a city is distrib-
uted over a relatively short air column. Thus, the temperature
of urban surface increases substantially at night.
Humidity Change
Urban development also has a certain impact on relative
humidity. The simulated results of the 2 m relative humidity
(Rh2) by the GLC2000 and GLC2009 cases in the January and
July are compared (see Figure 6). The relative humidity in the
main urban area was substantially lower than that in the other
areas, thereby forming a broad range of urban dry island. From
the monthly average 2 m relative humidity differences, the
expansion of the underlying surface resulted in a consistent
decrease in 2 m relative humidity in the central urban area of
Guangzhou in January and July. The monthly average of rela-
tive humidity in January and July decreased by 1.14 percent
and 2.1 percent, respectively. Relative humidity indicates
the moisture level of a block and is affected by the absolute
humidity and temperature. In urbanization, extensive areas of
arable land have been converted into construction land. Thus,
the ground water permeability is decreased, vegetation cover-
age area is reduced, rainwater is rapidly lost after the rain, and
the ground rapidly dries up, thereby resulting in the reduction
of the absolute water vapor content of the city. Furthermore,
the increase in urban temperature increases the saturated
vapor pressure. Thus, the relative humidity decreases.
Figure 4. Simulated spatial distribution of monthly average 2 m temperature (°C) in the GLC2000 and GLC2009 cases and the
monthly average 2 m temperature differences (differences = GLC2009−GLC2000)
PHOTOGRAMMETRIC ENGINEERING & REMOTE SENSING
September 2018
553


