location of concentrated water flow exiting a specific catch-
ment (Esri, 2012)) input for the watershed tool can be a point
shapefile or a raster dataset, the stormwater network facilities
(polygons), identified as retention ponds and exported into
the new shapefile, were converted to a raster dataset using the
Conversion/Polygon to Raster
tool. The land area draining into
these specific locales was identified, again using the
Spatial
Analyst/Hydrology/Watershed
tool with the new raster datas-
ets (the pour point) and the lidar-derived flow direction raster
as the inputs to the tool. In this manner, the land area for each
of these individual isolated catchments was delineated.
In each step, our visual analysis continued, using all
shapefiles, the raster datasets, and the aerial photos, i.e., turn-
ing on and off layers as needed to evaluate the flow direc-
tion. This step was essential to ensure that these “isolated”
stormwater facilities were, in fact, isolated, and not eventu-
ally draining into the main stream channel or a buffer zone
around the main stream channel.
Impervious surfaces or drainage pipes can also bring ad-
ditional water flow into the retention ponds: in some cases
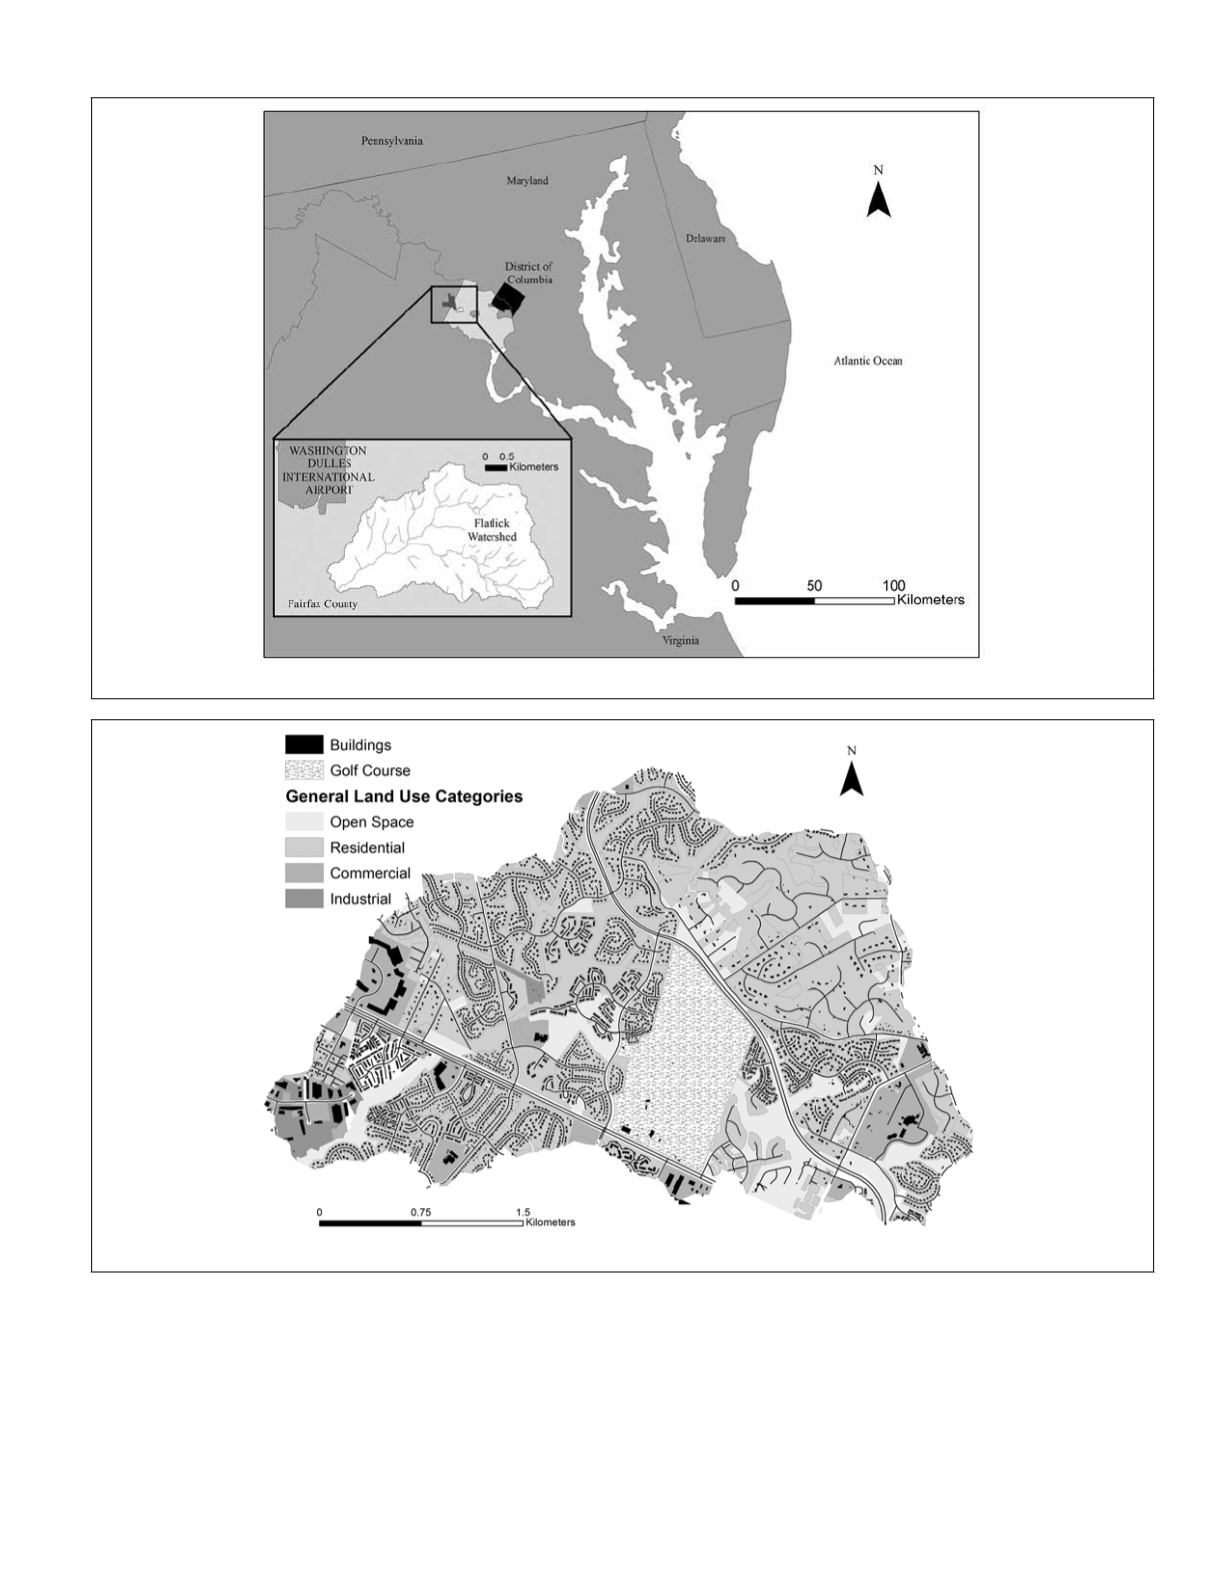
Figure 1. Location of Flatlick Branch of the Cub Run Stream, Fairfax County, Virginia.
Figure 2. Land use distribution within the boundaries of the US Geological Survey-delineated watershed.
PHOTOGRAMMETRIC ENGINEERING & REMOTE SENSING
May 2015
367


