filters, to determine what resolution/filter combination best
reflected a field-surveyed catchment boundary. Second, we
evaluated the accuracy of each lidar dataset and ability of
lidar-derived
DEMs
to characterize topography and terrain
features through comparison with field-determined slope mea-
surements and total station ground surveys. Finally, we exam-
ined variation in topographic metrics computed from
DEMs
of
varying resolution to determine the effects of grid cell size over
a range of high-resolution (10 m or less)
DEMs
. Overall, this
study aimed to provide guidance for researchers utilizing lidar-
derived
DEMs
in watershed-scale soil and hydrologic analyses.
Methods
Study Location
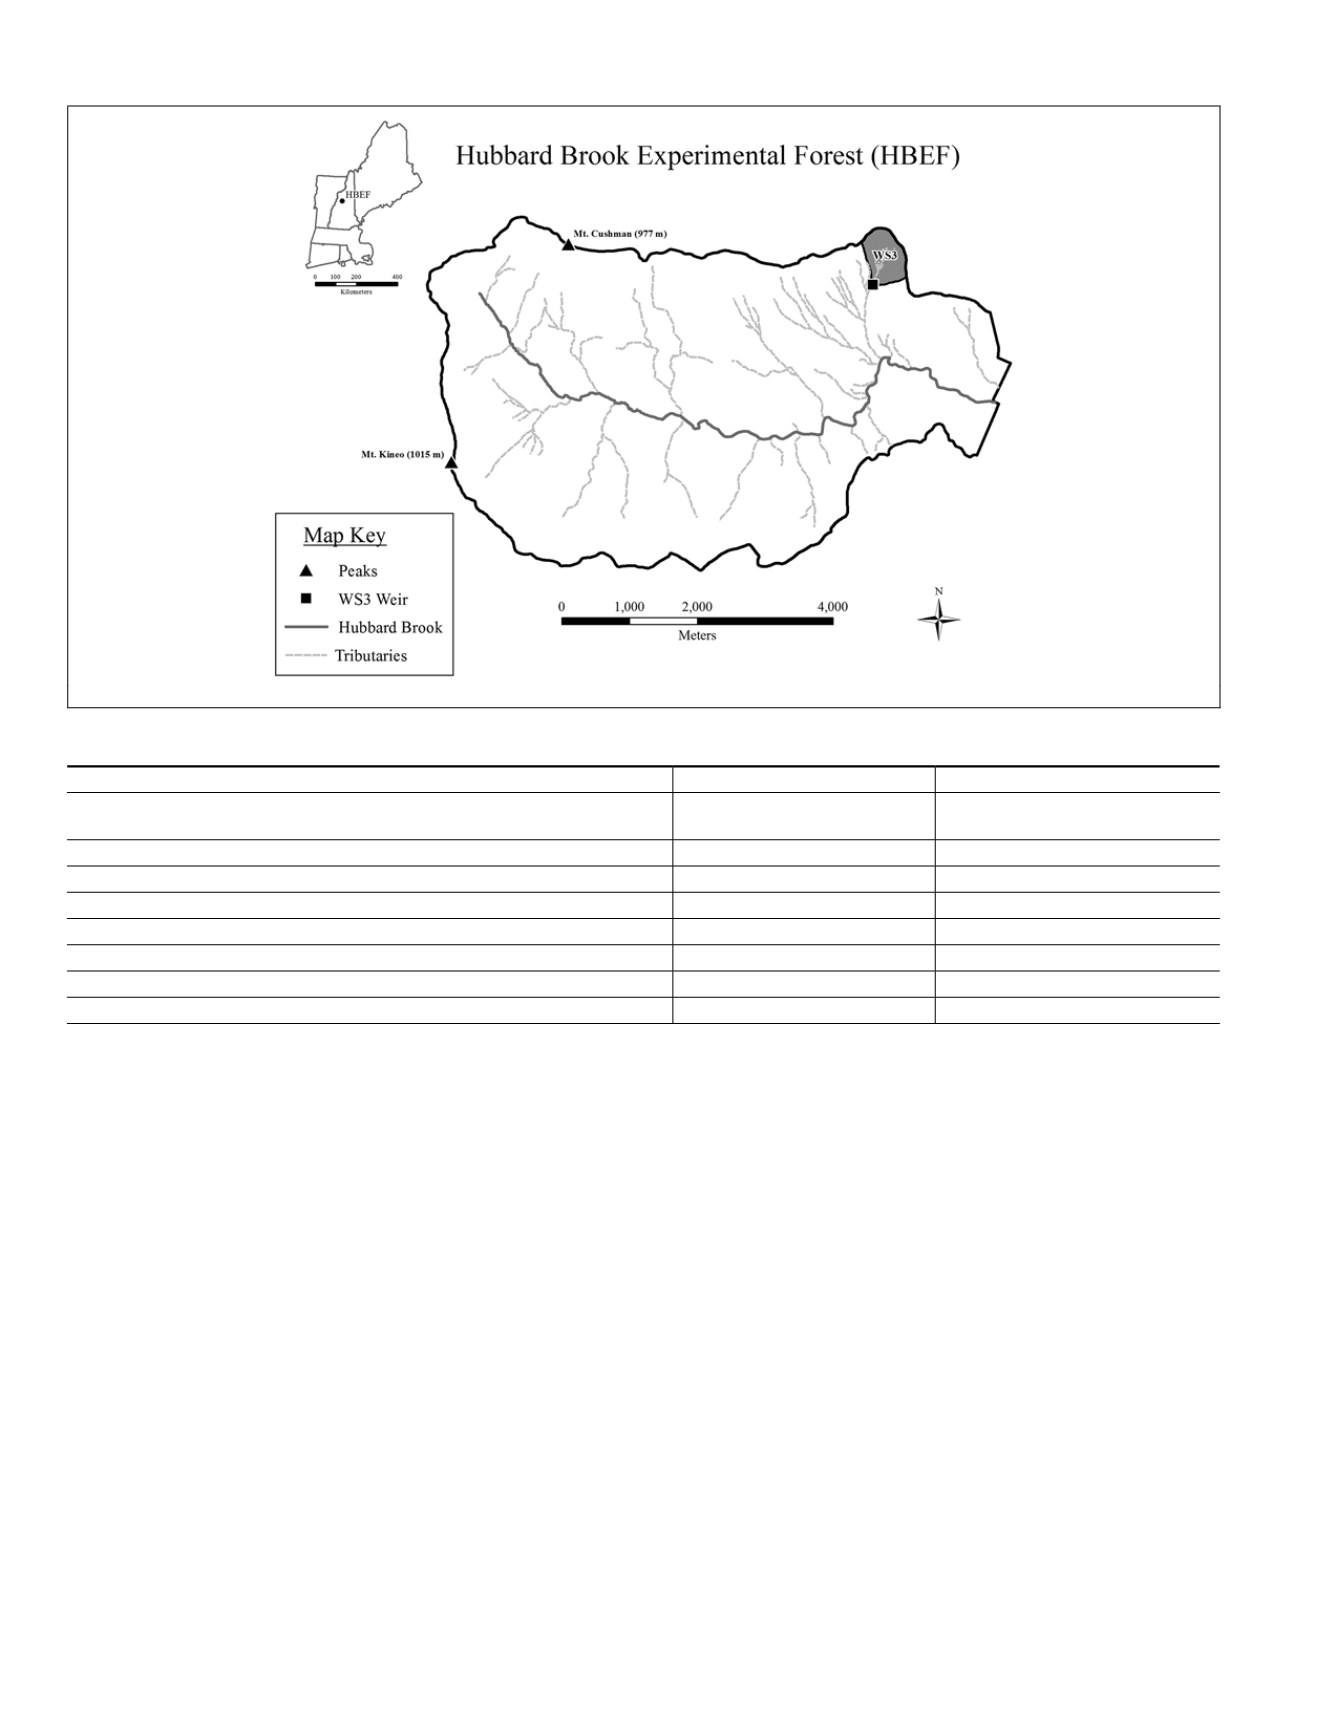
The Hubbard Brook Experimental Forest (
HBEF
) (Figure 1),
located in the White Mountains of New Hampshire (43°56’N,
71°45’W), is maintained by the United States Forest Service
(
USFS
), Northern Research Station and is part of the National
Science Foundation Long-Term Ecological Research (
NSF
LTER
) network. Watershed Three (WS3), the hydrologic refer-
ence catchment, is underlain by mica schist of the Silurian
Rangeley formation (Barton
et al.
, 1997) and partially covered
by glacial till of varying thickness. Soils are predominantly
Spodosols of sandy loam texture developed in glacial parent
materials (Likens, 2013). Elevation ranges from 527 m to 732
m. The western side of the catchment is characterized by
steep spurs flanking intermittent and perennial streams, while
the eastern side contains less well-developed drainage chan-
nels and areas of subtler topography. Bedrock outcrops are
most common near the catchment boundary. The catchment
is dominated by second-growth northern hardwood forest
including sugar maple (
Acer saccharum
), American beech
(
Fagus grandifolia
), and yellow birch (
Betula alleghaniensis
)
with shallow-to-bedrock areas dominated by red spruce (
Pi-
cea rubens
) and balsam fir (
Abies balsamea
) interspersed with
mountain white birch (
Betula cordifolia
). Understory vegeta-
tion is comprised mainly of patches of hobblebush (
Vibur-
num lantanoides
), a woody shrub, with scattered herbaceous
plants. The forest was partially harvested from 1870 to 1920,
damaged by a hurricane in 1938, and is not currently aggrad-
ing (Likens, 2013; Siccama
et al.
, 2007).
Lidar Data Collection and DEM Interpolation
Two lidar datasets were evaluated. The first was obtained by the
National Center for Airborne Laser Mapping (
NCALM
) in Novem-
ber 2009 as part of their Seed Proposal program, and the second
by Photo Science, Inc. in April 2012 for the United States Forest
Service White Mountain National Forest (
WMNF
). Both datasets
were collected during leaf-off and snow-free conditions using
an Optech GEMINI Airborne Laser Terrain Mapper and used to
Figure 1. Map of Hubbard Brook Experimental Forest, WS3, and location within New England, United States.
T
able
1. L
idar
D
ata
C
ollection
M
ethodologies
for
D
atasets
A
cquired
from
the
N
ational
C
enter
for
A
irborne
L
aser
M
apping
(
ncalm
)
and
the
W
hite
M
ountain
N
ational
F
orest
(
wmnf
); I
nformation
P
rovided
by
P
ost
-
project
R
eports
and
P
ersonal
C
ommunication with
R
epresentatives
of
ncalm
and
P
hoto
S
cience
, I
nc
.
Data Collection/Processing Method
NCALM
WMNF
Area of survey
Hubbard Brook Valley
(about 42 sq. km)
western White Mountain
National Forest (about 484 sq. km)
Approximate altitude above sea level
1600 meters
1800 meters
Swath width
400 meters
550 meters
Overlap
50%
30%
Classified file type/size
LAS, 1000 m × 500 m tiles
LAS 1.2, 2,000m × 2,000m tiles
Ground Return Density over WS3 only (ppsm = points per square meter)
3.27 ppsm
1.16 ppsm
Vertical RMSE
0.0720 meters
0.124 meters
Ground control stations
3 (Hubbard Brook Valley only)
37 (entire WMNF)
388
May 2015
PHOTOGRAMMETRIC ENGINEERING & REMOTE SENSING


