43.0 ha (unfiltered
WMNF
10 m) (Table 2). The mean of water-
sheds delineated using
NCALM DEMs
was 42.0 ha and the mean
of watersheds delineated using
WMNF DEMs
was 42.2 ha. In
general, coarse (10 m) and fine (1 m)
DEMs
tended to generate
watersheds containing areas least similar to the overall means,
while intermediate (3 m and 5 m)
DEMs
tended to generate
watersheds containing areas most similar to the overall means
(Table 2) and the conventionally surveyed boundary.
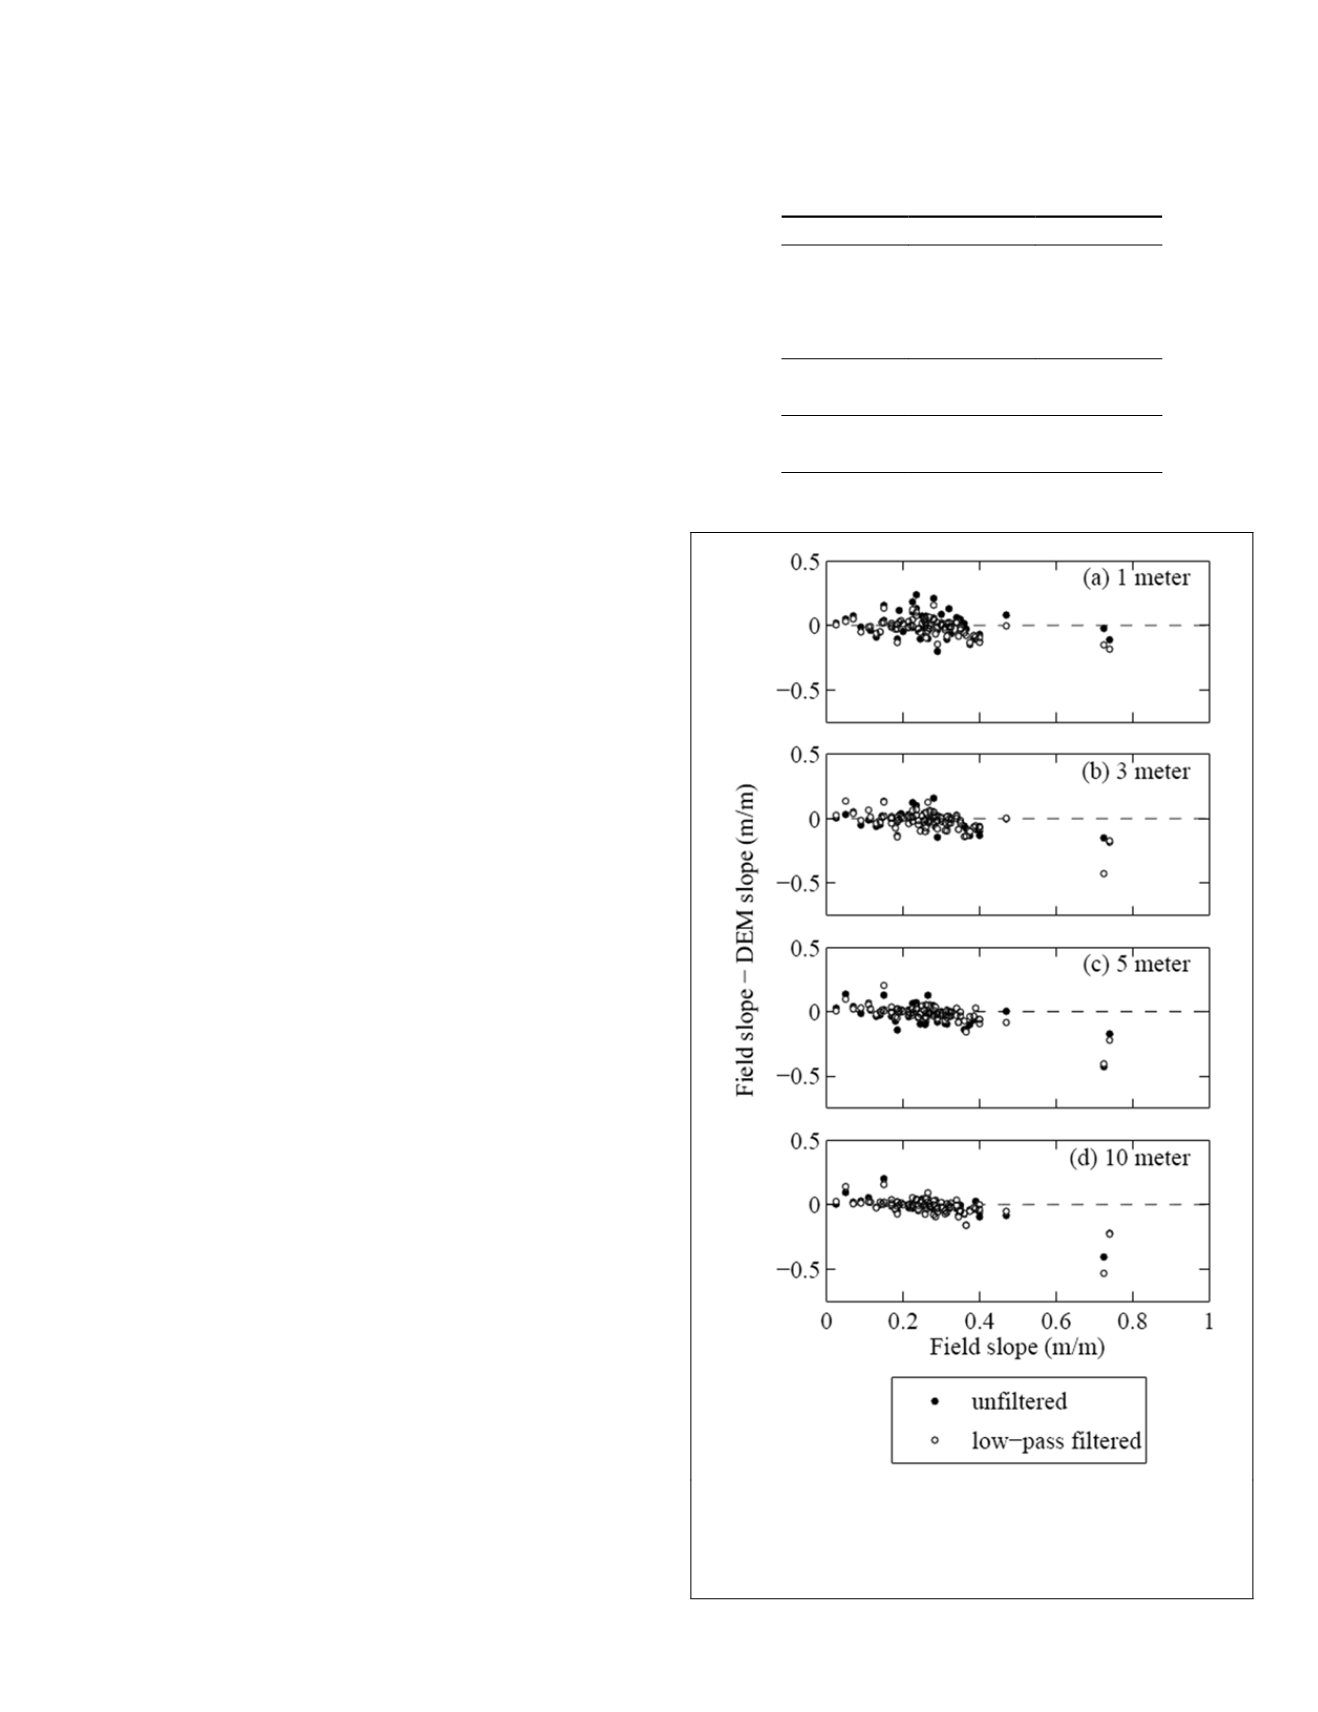
Comparison of Field and DEM Slope Measurements
The 1 m
DEMs
generated slope values most different from
field measurements, with the exception of the steepest slopes
(Figure 3). A one-way analysis of variance indicated no
statistically significant differences (
α
= 0.05) between
DEMs
of
the same resolution/filter combination derived from
NCALM
and
WMNF
lidar datasets, so for ease of visualization only
NCALM
scatterplot data are shown. Twenty-nine percent of
the
NCALM
1 m
DEM
slopes and 23 percent of the
WMNF
1 m
DEM
slopes exhibited a difference from field slope greater
than 10 percent. In general, difference between field and
DEM
slope values decreased with
DEM
coarsening. Filtering made
no significant impact on
DEM
slope computation. A one-way
analysis of variance comparing field slope measurements with
DEM
-computed slopes indicated no statistically significant dif-
ferences between the means (
α
= 0.05).
Total Station Ground Surveys
To determine if small scale terrain features were included
when lidar returns were classified as ground points and used
to interpolate a bare earth model, we compared
RMSE
for loca-
tions with and without terrain features. We also compared
RMSE
for the cleared rain gage area with
RMSE
for sites under
mature forest canopy to determine the effects of canopy on
lidar in a northern hardwood forest. In the rain gage clearing,
the
RMSE
was 1.06 m for the
NCALM DEM
and 1.24 m for the
WMNF DEM
. Under canopy, the
RMSE
was 1.32 m for the
NCALM
DEM
and 1.52 m for the
WMNF DEM
(Table 3). Locations on or
adjacent to terrain features exhibited an
RMSE
of 1.49 m for
the
NCALM DEM
and 1.66 m for the
WMNF DEM
, while locations
without terrain features exhibited an
RMSE
of 1.03 m for the
NCALM DEM
and 1.18 m for the
WMNF DEM
(Table 3). RG5 had
the greatest
RMSE
value when computed by survey site (Table
3). Greater
RMSE
values were observed for both datasets at lo-
cations with terrain features versus non-feature survey points.
In most cases, total station measurements yielded a greater
relative elevation difference than the
DEM
between benchmark
and terrain feature survey locations.
Topographic Metric Comparison
Boxplots were used to compare the distributions of topo-
graphic metric values computed for each
DEM
resolution/filter
combination (Figure 4). A one-way analysis of variance indi-
cated no statistically significant differences (
α
= 0.05) between
DEMs
of the same resolution/filter combination derived from
NCALM
and
WMNF
lidar datasets, so for ease of visualization
only
WMNF
distributions are shown. Filtering and
DEM
coars-
ening decreased slope variance and interquartile range (
IQR
).
Slope
IQR
decreased from 17 percent to 7 percent (Figure 4a).
Median planform curvature did not change with filtering or
cell aggregation (Figure 4b). Planform curvature variance was
consistently lower for the filtered version of each
DEM
resolu-
tion (Levene’s test statistic = 47.22,
α
= 0.05). The 3 m and 5
m
DEMs
tended to produce planform curvature values with
the narrowest distributions (Figure 4b). Median
UAA
values
increased for both the
NCALM
and
WMNF DEMs
from 188 m
2
and 174 m
2
to 3411 m
2
and 3098 m
2
, respectively.
UAA
maps
indicated that for finer-resolution
DEMs
the watershed was
dominated by grid cells with small
UAAs
(Plate 1). As
DEMs
were coarsened,
UAA
values became larger, and median
TWI
T
able
3. RMSE
for
E
ach
T
otal
S
tation
S
urvey
S
ite
, L
ocations
U
nder
M
ature
C
anopy
and
in
the
R
ain
G
age
C
learing
,
and
L
ocations
W
ith
and
W
ithout
T
er
-
rain
F
eatures
. R
elative
E
levation
D
ifferences
between
T
otal
S
tation
S
urvey
B
enchmark
/S
urvey
L
ocations
and
C
orresponding
dem
B
enchmark
/S
urvey
L
ocations were
U
sed
to
C
ompute
rmse
Site ID
NCALM WMNF
LowerK
0.69
0.73
UpperK
0.73
0.71
SO2
0.77
0.98
RG5
1.84
2.07
Canopy
1.32
1.52
Clearing
1.06
1.24
Feature
1.49
1.66
No Feature
1.03
1.18
Figure 3. Field slope values measured using a clinometer for 75
locations corresponding with soil pits and shallow subsurface
wells were compared with the difference between field and
dem
slope measurements computed using the maximum slope algo-
rithm for
ncalm
1, 3, 5, and 10 m
dem
s
.
PHOTOGRAMMETRIC ENGINEERING & REMOTE SENSING
May 2015
391


