2. The
CART
decision tree classifier in the eCognition
software was employed for the 2001 dataset in a similar
way as previously described. Classification results for
the 2010 image were introduced through the classifica-
tion of the 2001 image. Change data for 2001 to 2010
were extracted based on the 2010 classification results.
Taking mining class changes as an example, patches
classified as mines in 2010 and their properties meet-
ing the forest criterion based on the decision tree rule
in 2001 were classified as a changing class, from forest
in 2001 to mine in 2010. Other changing classes were
recognized using a similar method.
3. Generate the 2001 classification map and land cover
changes map, which are shown in Plate 1d and Plate 1f.
Results and Discussion
In both the 2001 and 2010 land-cover classification maps,
forested land dominates, followed by grassland and farmland,
with these three land-cover classes occupying over 90 percent of
the total study area (see Table 3 and Table 6). Over the ten-year
period, the regional extent of each land cover class changed over-
time as a result of dynamic land use transitions, wherein mining
regions and towns changed most notably (Plate 1d and Plate 1e).
Accuracy Assessment of the Classification Result
For the 2010 classification results, the ERDAS Imagine
™
software
) was used to randomly generate 763
validation points based on area proportions for each class. To
ensure that small area classes were given sufficient valida-
tion points, the lowest number of points was set to 50. A field
campaign was carried out in November 2012, and validation
points generated by the ERDAS Imagine software were geo-
located using high accuracy global positioning system (
GPS
)
measurements. At each plot location in the field, the land-
cover types were determined, and photos were taken with
a digital camera for future reference. Considering the occur-
rence of the discrepancy between the field campaign and the
acquisition of remote sensing data, we further consulted re-
gional experts for the land-cover changes in recent two years
to avoid possible errors. Accuracy assessments were per-
formed with validation data collected through fieldwork. The
results show that the overall image classification accuracy
level was 92.01 percent and that the overall Kappa coefficient
(Congalton and Mead, 1983) was 0.8978 for the 2010 data-
set. The confusion matrix and overall accuracy of each class
(Story and Congalton, 1986; Congalton, 1991) for the 2010
image are shown in Table 4. It was impossible to conduct an
accuracy assessment of the 2001 classification results using
data collected through fieldwork. As the 2001 classification
was derived from the 2010 validated results, the 2001 dataset
had followed an evaluation of regional experts and an inde-
pendent validation procedure. Accuracy assessments were
carried out for the 2001 land cover map where 353 random
sample sites were selected. Then, these sites were reinter-
preted by independent regional experts who have abundant
experiences in local land cover and mining data interpreta-
tion, particularly for the study site in 2001. Overall agreement
between classification results and re-interpretations (consid-
ered as reference information) was recorded at 89.24 percent
for the seven land cover classes (Table 5).
Land Cover Change Analysis
Table 6 shows that the stone mining area expanded from 2.1
km
2
in 2001 to 7.9 km
2
in 2010, i.e., nearly quadrupling over
the ten years. This rapid expansion of mining regions can be
largely attributed to significant demands for stone minerals
in rapidly urbanizing areas of China over the past decade.
Additionally, to obtain high-quality stone minerals (called
“big blocks”), deep mining activities must be carried out.
Stones mined from the Earth’s upper surface and smaller
stones are often wasted. Discarded rocks often account for a
large proportion of stones mined, forming large quantities of
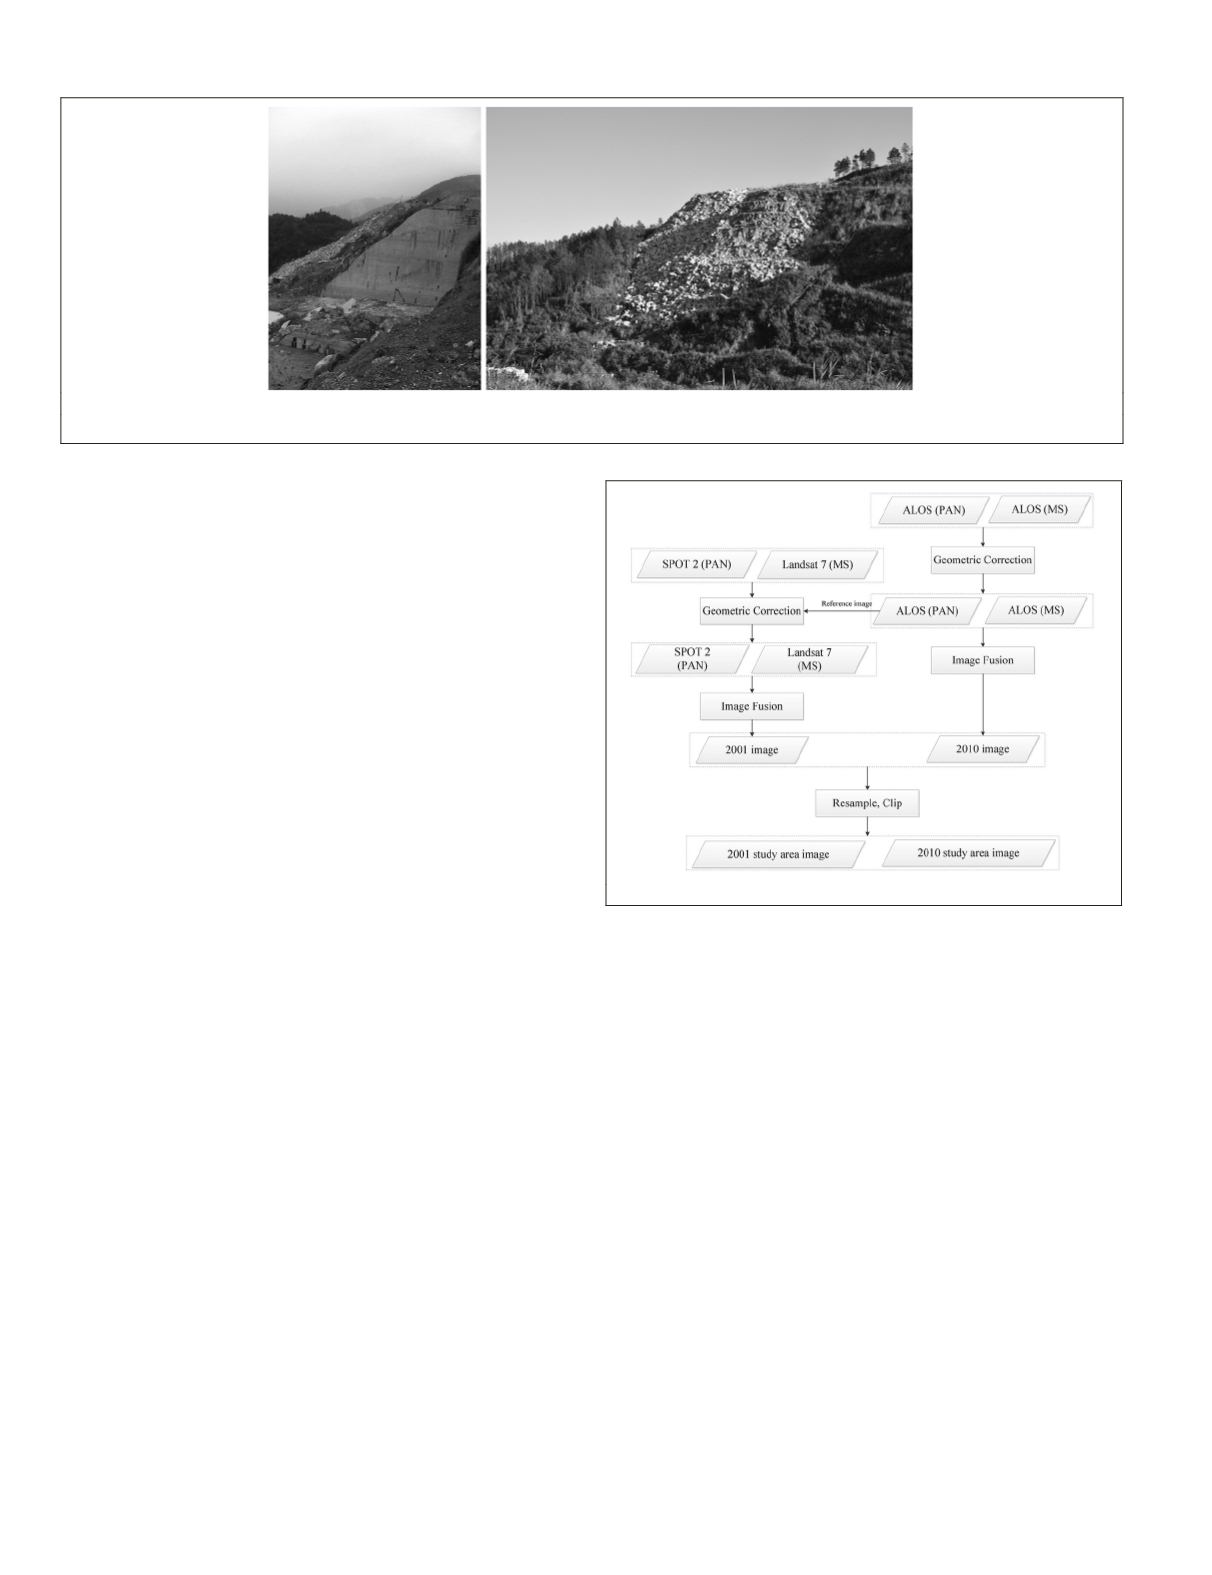
waste rock dumps in the mining region (Figure 2). The 2010
imagery shows that the mining area can be classified further
into digging areas and mine dumping and tailing areas, and
the digging area was measured at 1.1 km
2
. The digging area
(a) (b)
Figure 2. Two photos taken in the field: (a) mining region digging area, and (b) mine dumps and tailings.
Figure 3. Data preprocessing procedures.
748
September 2015
PHOTOGRAMMETRIC ENGINEERING & REMOTE SENSING


