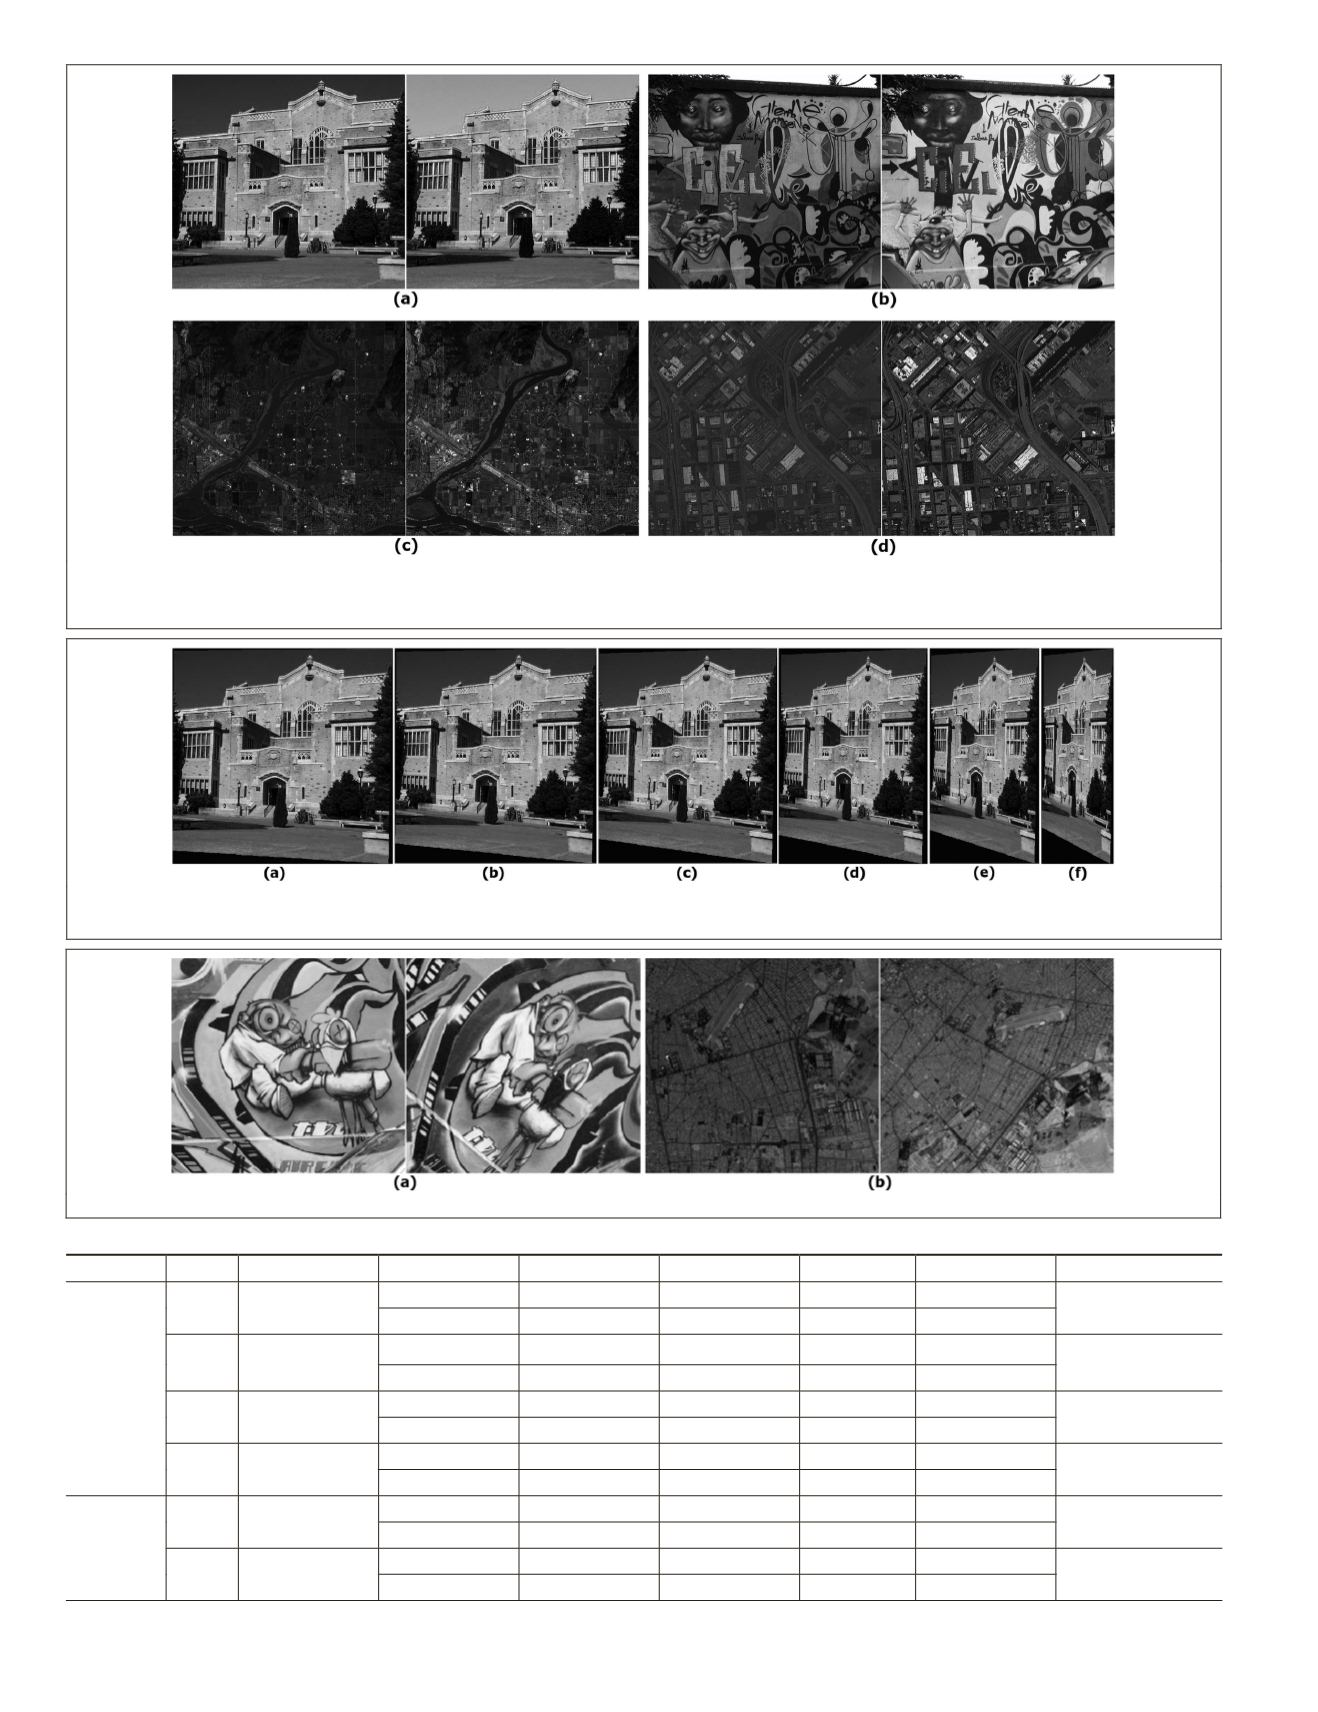
Figure 5. Input data sets for simulation: (a)
ubc
close range images in band red (left) and blue (right), (b) Graffiti close range images in
band red (left) and blue (right), (c) satellite images from
spot5
in band 1 (left) and band 2 (right), and (d) satellite images from worldview
in band 1 (left) and band 4 (right)
Figure 6. An example of simulated images generation for different viewpoints: (a) through (f) simulated images for 20, 30, 40, 50, 60, 70
degrees, respectively, for viewpoint angle.
Figure 7. Real input data sets: (a) Graffiti image pairs, and (b)
spot
4
image pairs.
T
able
1. I
nput
I
mage
P
airs
Category No.
Image Type
Image pair Spectral mode Image size
GSD (m)
Bits per pixel
Location
Simulate Images
1
Close Range
UBC
Band 1 (Red)
600×650
-
8
-
UBC
Band 3 (Blue)
600×650
-
8
2
Close Range
Graffiti
Band 1 (Red)
600×650
-
8
-
Graffiti
Band 3 (Blue)
600×650
-
8
3
Satellite
SPOT 5
Band 1
600×650
10
8
Canada-
Vancouver
SPOT 5
Band 2
600×650
10
8
4
Satellite
World View 2
Band 1
600×650
0.5
11
USA-San Francisco
World View 2
Band 4
600×650
0.5
11
Real Im-
ages
5
Close Range
Graffiti
Band 1 (Red)
600×650
-
8
-
Graffiti
Band 3 (Blue)
490×451
-
8
6
Satellite
SPOT 4
Pan
600×650
10
8
Iran-Tehran
SPOT 4
Pan
600×650
10
8
738
September 2015
PHOTOGRAMMETRIC ENGINEERING & REMOTE SENSING


