2004, Otukei
et al
., 2010, Hodgson
et al
., 2003). Object-ori-
ented techniques and
DTC
complement each other. Object-ori-
ented analyses produce numerous features including spatial,
spectral, textural, and contextual information, and the
DTC
is well suited to sort through those features generated by the
object-oriented analysis and determine which best describe a
terminal class in the classification tree.
The
CART
decision tree classifier in the eCognition software
was used in this study. In
CART
, a maximal tree was grown,
then a training process was performed, and the maximal tree
was pruned back to obtain the optimal tree by determining
the lowest misclassification errors. Before training the deci-
sion tree, we need to calculate various features associated
with a class as much as possible which is beneficial to take
full advantage of the decision tree algorithm to automatically
discover features to distinguish different classes, and then
generate optimal discrimination rules. In this study, a total
of 39 features were selected, including spectral, shape, slope,
and textural features;
DEM
,
NDVI
, and
NDWI
(McFeeters, 1996).
Spectral features included mean and variance of brightness
for each band; shape features of each area, perimeter, and
perimeter area ratio; and textural features regarding degrees of
homogeneity based on the Gray Level Co-occurrence Matrix
(
GLCM
), contrast, entropy,
ASM
energy, and autocorrelation
measurements (Trimble 2011).
For each land-cover class, at least 50 training samples were
available for analysis, and a total of 1,238 and 1,156 training
samples were used for the 2010 and 2001 datasets, respec-
tively. The training samples were randomly divided into ten
subsamples with an equal distribution. With this random
training technique, 90 percent of the subsamples were used
to generate a decision tree, and the results were evaluated
using the 10 percent testing samples that were kept separate
from the tree-building process. This process was repeated
ten times; each time reserving a different 10 percent of the
sample for error assessment. In order to prevent over fitting of
the tree, splitting was stopped when a terminal node had less
than ten cases.
Retrospective Approach
A comparison between the 2001 and 2010 images shows that
most land-cover classes remained largely unchanged over the
past ten years with the exception of urbanized and mining
land. Thus, a retrospective approach was employed. This
approach rendered classifications of the 2001 image more ac-
curate and efficient and involved the following tasks:
1. The segmentation of the 2001 image was constrained
by the patch boundary of the 2010 land-cover types.
Segmentation parameters were determined following
the method previously described.
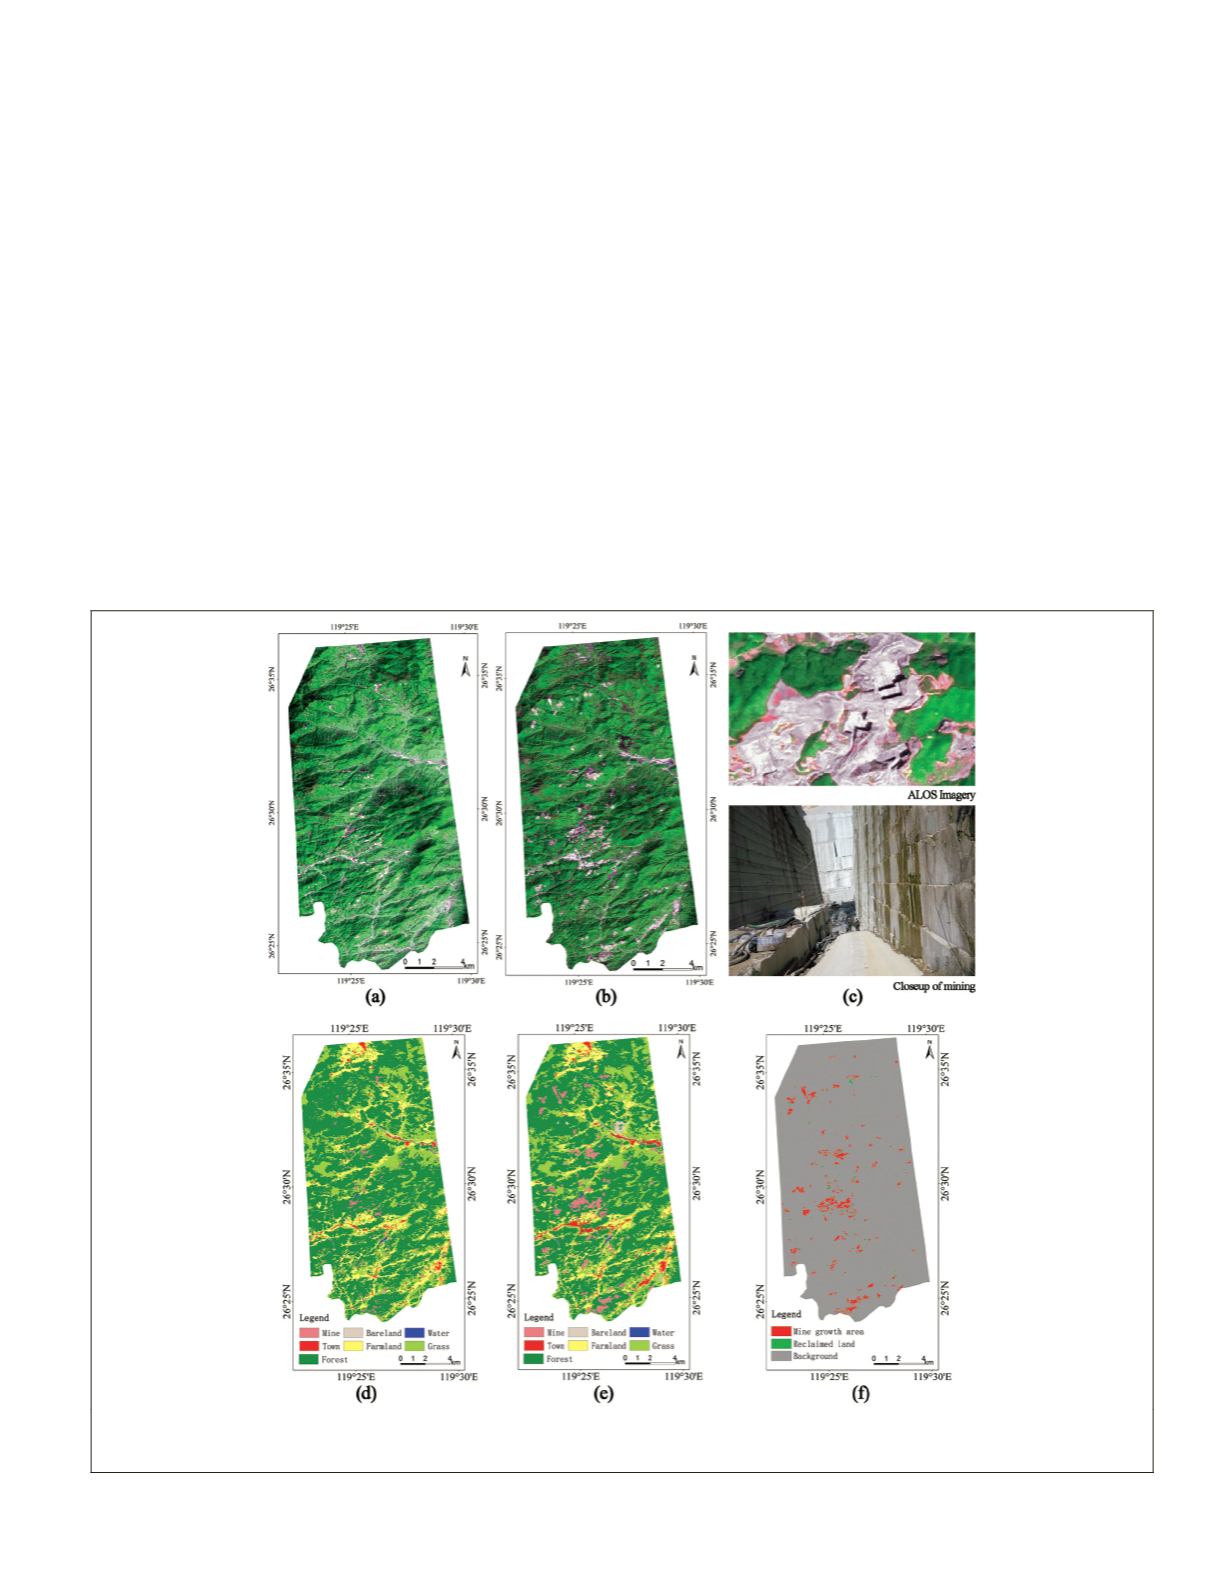
Plate 1. Preprocessed satellite images and land cover and change detection results: (a) image of 2001(RGB: bands342 ), (b) image
of 2010(RGB: bands342 ), (c) satellite image and digital picture,(d) classification map in 2001,(e) classification map in 2010, and (f)
Changes in mined region.
PHOTOGRAMMETRIC ENGINEERING & REMOTE SENSING
September 2015
747


