Data and Methods
Study Area
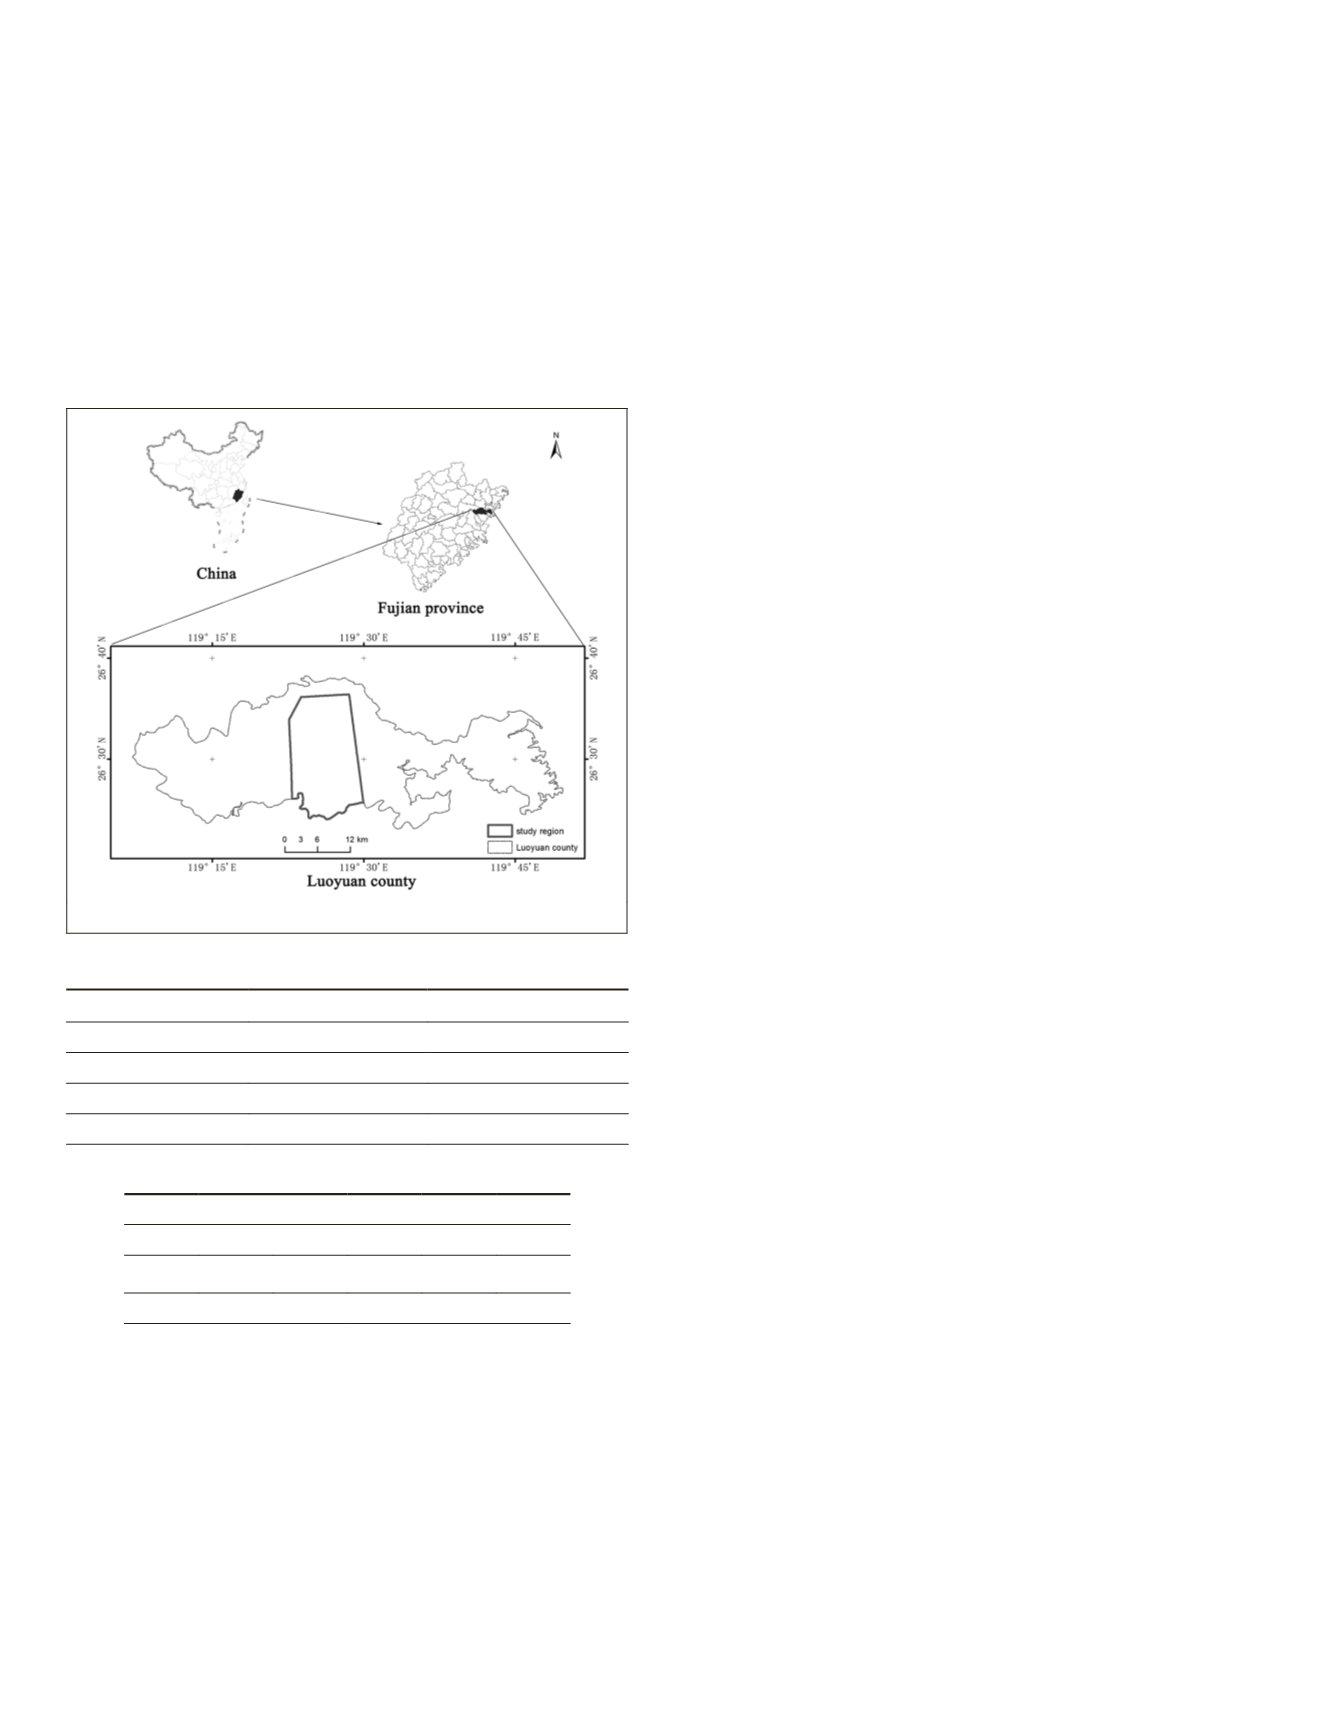
The study area is situated in Luoyuan county, Fujian province
of southeastern China. (Figure 1). The county is characterized
by a humid sub-tropical monsoon climate with a mean annual
precipitation of 1,652 mm. Average annual temperatures are
recorded at 19.6°C, and average monthly temperatures range
from 9.6°C in January to 28.5°C in July. The county includes
one of the most prominent stone mining areas in China. The
exploitation of stone resources has significantly altered local
land cover patterns over the last ten years, causing a series of
eco-environmental problems.
Figure 1. location of the study area.
T
able
1. S
atellite
I
magery
U
sed
Data
Resolution (m)
Date
ALOS (PAN)
2.5
18 March 2010
ALOS(MX)
10
18 March 2010
SPOT2 (PAN)
10
2 March 2001
Landsat-7(MS)
30
4 March 2001
T
able
2. M
ining
A
rea
M
ulti
-S
egmentation
S
tatistics
Scale 40
50
80
100 200
N 412 235 152
49
14
N
part
0
4
10
14
7
N
c
100% 98% 93% 71% 50%
Data
Satellite Image Data
In this study,
ALOS
,
SPOT2
, and Landsat-7 satellite images were
used to examine land cover changes in the mined region of
Luoyuan county.
Other Auxiliary Data
Vector data of the administrative border and
DEM
and
SLOPE
data for the study area were also used. These data were drawn
from the Computer Network Information Center of the Chi-
nese Academy of Sciences
.
Data Preprocessing
First, image preprocessing tasks were conducted, including
geometric correction, data fusion, image resampling, and im-
age subset:
1. The
RPC
(Rational Polynomial Coefficient) model was
used to geometrically correct
ALOS
images for 2010.
The corrected
ALOS
images were then used as a refer-
ence to geometrically correct the
SPOT2
and Landsat-7
images.
2. To identify the best fusion approach, the results of
various fusion algorithms (i.e., brovey, IHS transform,
wavelet transform, principal component transform,
and pansharp) were compared. After a comprehensive
comparative study was conducted, the pansharp fusion
model was selected to fuse
ALOS
panchromatic and
multispectral images for 2010 and
SPOT2
panchromatic
and Landsat-7 multispectral images for 2001.
3. The 2001 fused images were resampled to a spatial
resolution of 2.5 m.
4. Both images for 2010 and 2001 were clipped to the
study area boundary.
Plate 1a and 1b present the image preprocessing results.
Object-oriented Satellite Imagery Classification
Image Segmentation
Object-based classification procedures first involved image
segmentation tasks using the Trimble eCognition
©
commercial
software program, which employs object-oriented strate-
gies to mimic processes of human perception and to define
objects by several criteria including color, shape, size, texture,
pattern, and context. The segmentation algorithm applied in
our work follows the multi-scale object-oriented Fractal Net
Evolution Approach (Baatz and Schäpe, 2000). Segmentation
involves merging a one-pixel image segment with neighbor-
ing segments until a heterogeneity threshold, named a scale
parameter and determined by segmentation parameters, is
reached (Benz
et al
., 2004). Image segmentations significantly
influence feature extraction and image classification results.
To analyze images at multiple scales, a series of segmenta-
tions were performed using various scale parameters. Taking
the mine class as an example, weight parameters were set to
0.1/0.9 for shape/color features and to 0.5/0.5 for smoothness/
compactness features, and scale parameters were set to 40, 50,
80, 100, and 200. Optimum scale parameters were determined
through combined visual interpretation and statistical analy-
ses. In Table 2, N denotes the total number of mining objects
in the samples, N
part
denotes the number of sampled objects
that partly include mine activities, and N
c
reflects a segmenta-
tion accuracy equaling to 100% * (N-N
part
)/N.
Table 2 shows that the segmentation accuracy reached 98
percent with a scale parameter of 50. Under-segmentation
becomes evident with an increase in scale parameters, and
smaller scale parameters result in over-segmentation. Thus,
the optimum scale parameter for the mining class was set
to 50. Similarly, the optimum scale parameter for farmland,
forest, and grassland was set to 60; that for town and bare
land was set to 50; and that for water was set to 40. As dif-
ferences between the optimum scale parameters of the seven
classes were minor, a scale parameter of 50 was finally set as a
unique scale parameter for the whole image. This step proved
conducive to the performance of decision tree classifications
of the same segment scale (Laliberte
et al
., 2007).
Decision Tree Classification
The decision tree classifier (
DTC
) has recently been empha-
sized in the remote sensing community, and with
DTC
, better
classification results were often obtained than other classi-
fication methods (Friedl and Brodley, 1997; Lawrence
et al
.,
746
September 2015
PHOTOGRAMMETRIC ENGINEERING & REMOTE SENSING


