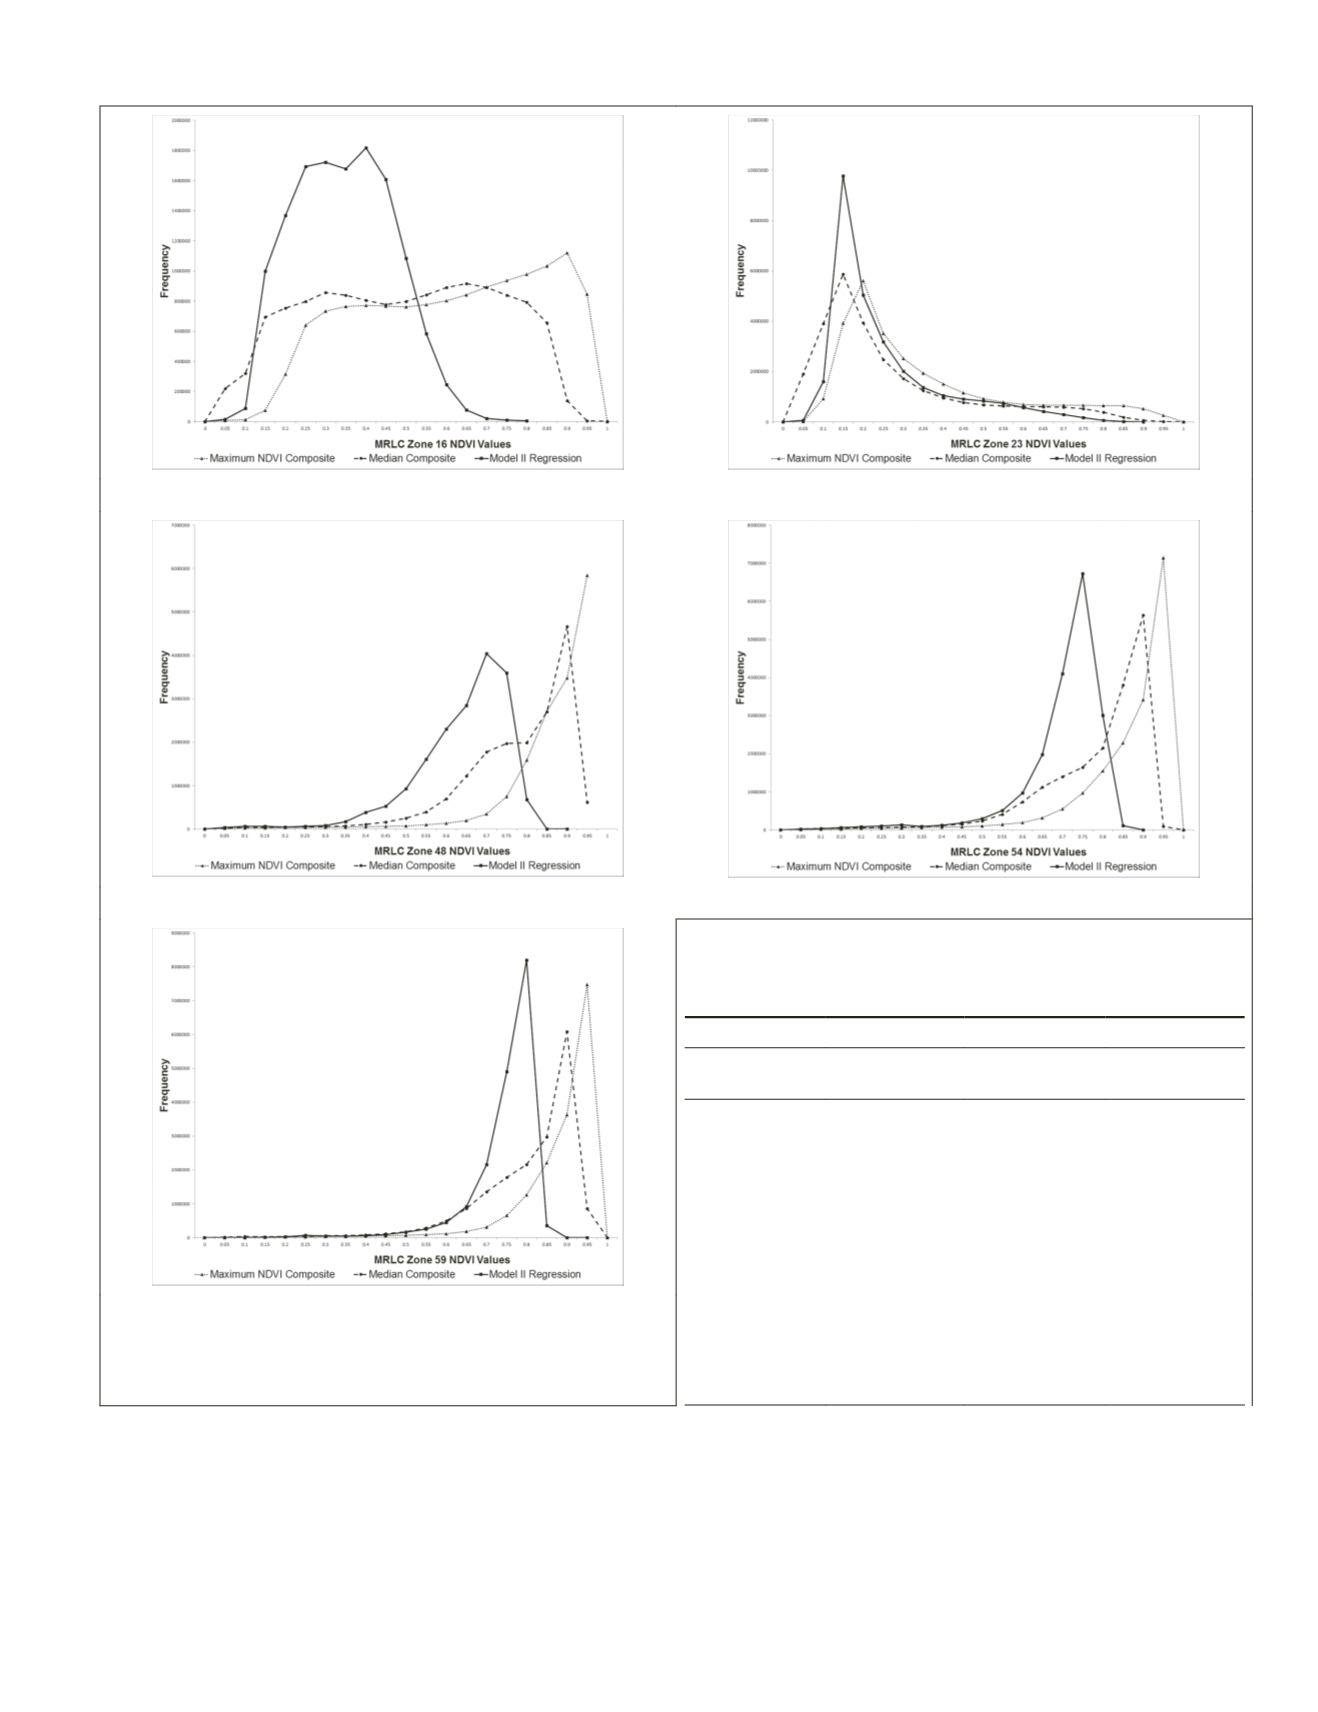
observed in the maximum
NDVI
composites are L5 anomalies,
which are not visible in the median composites or the model
II regression mosaics.
Modeling Percent Canopy Cover
The random forest
OOB
percent variance explained and mean
of squared residuals results are shown in Table 6. For the two
western zones (16 and 23), the random forest model created
using the model II regression mosaic had the highest percent
variance explained (64.0 and 51.8, respectively) and the low-
est mean of squared residuals (224.1 and 159.7, respectively).
For the three eastern zones (48, 54, and 59), the random forest
model created using the median composite had the highest
percent variance explained (85.9, 85.2, and 80.9, respectively)
and the lowest mean of squared residuals (234.3, 186.2, and
275.4, respectively).
(a)
(b)
(c)
(d)
T
able
5. P
ercent
of
P
ixels
U
sed
for
E
ach
D
ate
in
the
M
odel
II R
egression
M
osaic
for
M
ulti
-R
esolution
L
and
C
haracteristic
M
apping
Z
ones
16, 23,
48, 54,
and
59
Zone 16 and 23
Zone 48, 54, 59
Acquisition
Date
Percent of
Total Pixels
Acquisition
Date
Percent of
Total Pixels
27-Sep-09
33% 01-Oct-09
18%
21-Sep-10
15% 02-Oct-10
17%
26-Oct-09
14% 09-Oct-10
12%
19-Aug-09
14% 30-Sep-10
12%
16-Sep-10
13% 20-Sep-10
12%
21-Aug-09
10% 11-Oct-10
10%
02-Oct-09
0% 10-Aug-10
8%
29-Sep-09
5%
29-Oct-10
4%
08-Oct-09
3%
(e)
Figure 4. Frequency of NDVI values for Multi-Resolution Land Char-
acteristic zones 16 (a), 23 (b), 48 (c), 54 (d), and 59 (e) generated
from the model II regression mosaic (solid line), median composite
(dashed line), and maximum NDVI composite (dotted line).
PHOTOGRAMMETRIC ENGINEERING & REMOTE SENSING
March 2016
205


