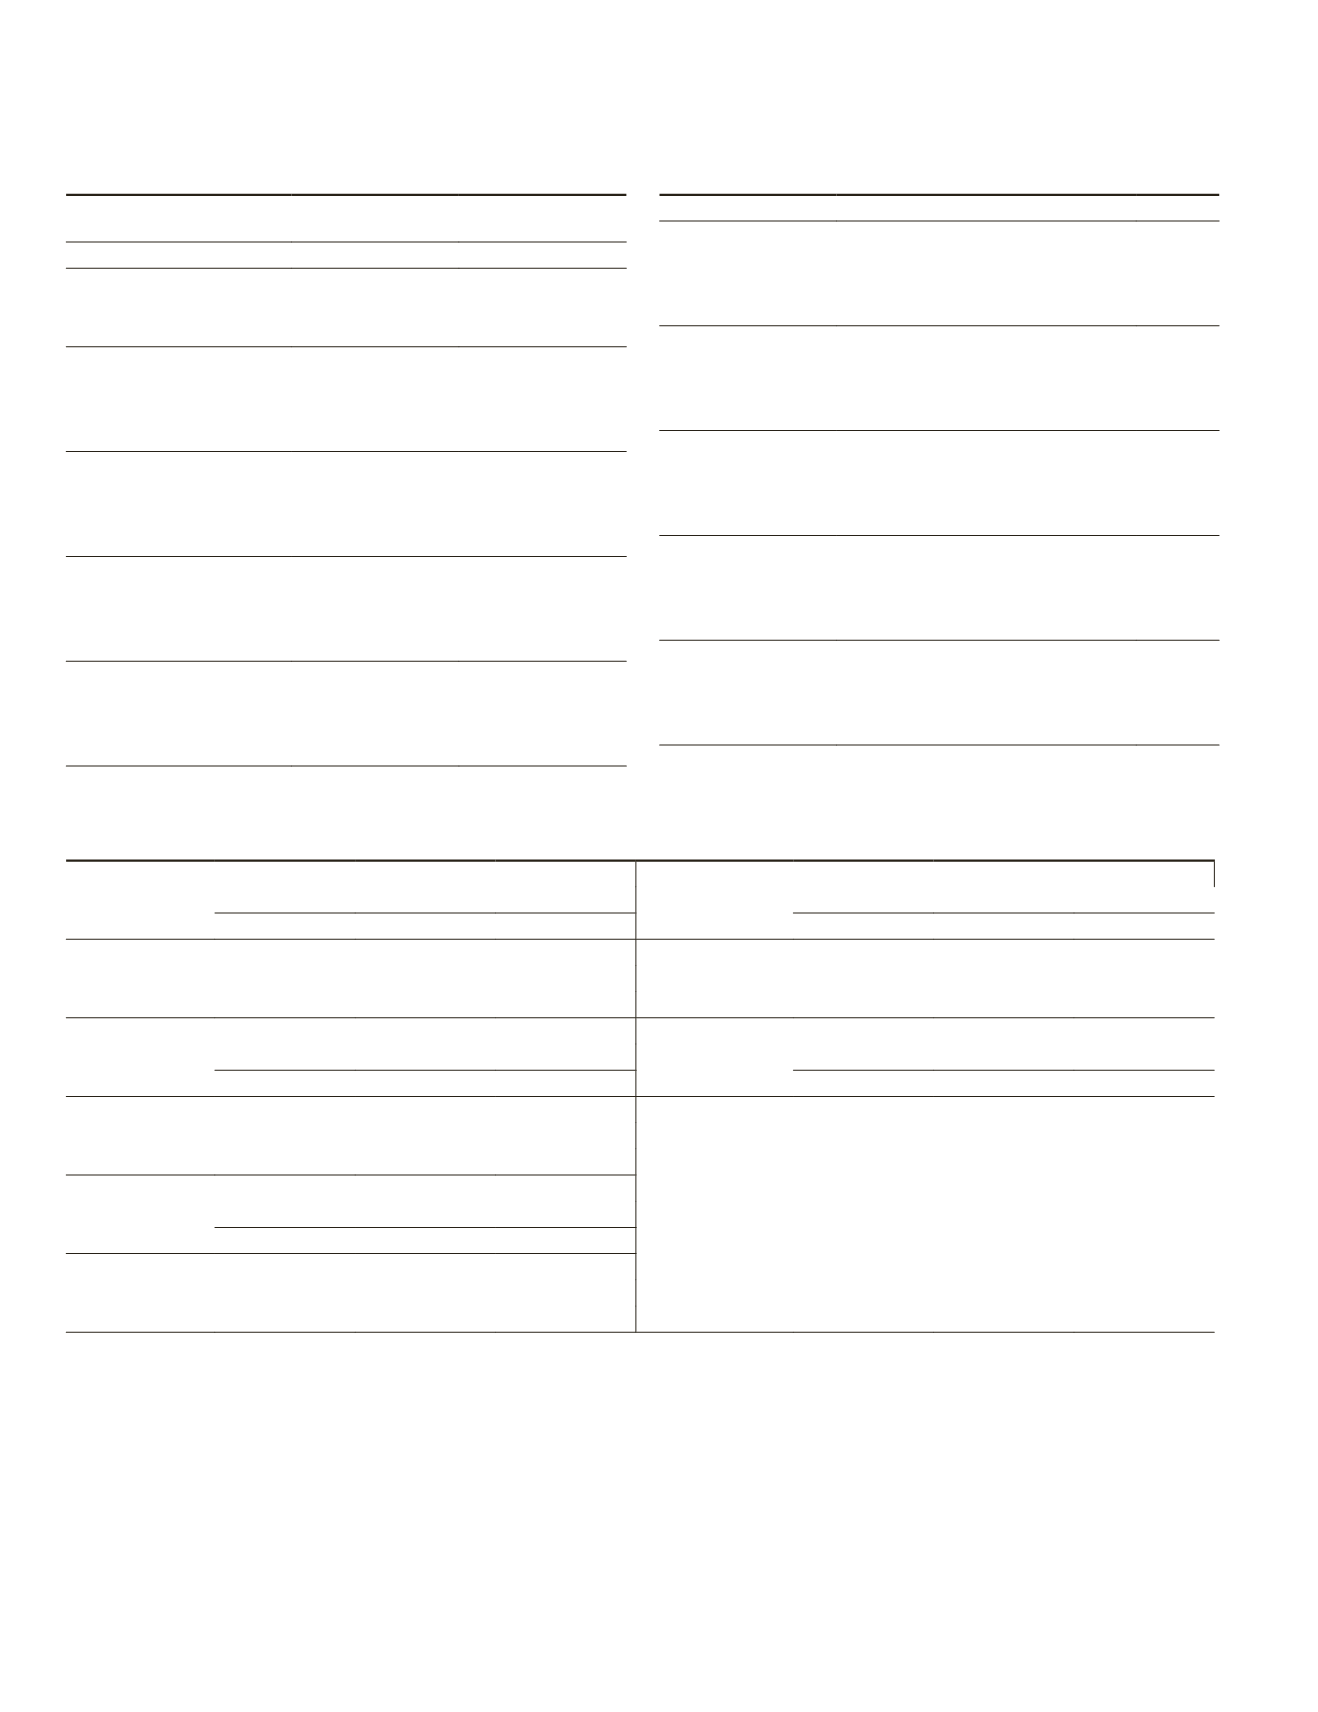
Wilcoxon signed rank tests found three comparisons that
were significant (Table 7). For zone 23, the
OOB
predictions
for the model II regression mosaic were significantly differ-
ent than the
OOB
predictions derived for both the median and
maximum
NDVI
composites. The
OOB
predictions derived us-
ing the model II regression mosaic were 2 percent lower than
the
PTCC
predictions derived using the median and maximum
NDVI
composites. For zone 54, the
OOB
predictions derived us-
ing the maximum
NDVI
composite were significantly different
than the
OOB
predictions derived using the median compos-
ite. The
OOB
predictions derived using the median composite
were 5 percent higher than the
OOB
predictions derived using
the maximum
NDVI
composite. There were no other significant
differences between the
OOB
predictions derived using the
different composite types.
To further examine differences in
PTCC
predictions derived
using the different composite types,
PTCC
estimates and 95
percent confidence limits were derived for the median com-
posite, maximum
NDVI
composite, and the model II regression
mosaic. Table 8 presents the percentage of all
PTCC
values in a
reference image (left column) that fell outside the 95 percent
confidence limits as predicted by the comparative image (top
T
able
6. P
ercent
T
ree
-C
anopy
C
over
R
andom
F
orest
M
odels were
C
reated
for
the
M
ulti
-R
esolution
L
and
C
haracteristic
M
apping
Z
ones
16, 23, 48,
54,
and
59. T
he
R
andom
F
orest
M
odels
O
ut
-
of
-B
ag
P
ercent
V
ariance
E
xplained
and
the
M
ean
of
S
quared
R
esiduals
are
S
hown
H
ere
Percent Variance
Explained
Mean of Squared
Residuals
Zone 16
Max NDVI Composite
62.5
233.7
Median Composite
63.9
225.0
Model II Regression Mosaic
64.0
224.1
Zone 23
Max NDVI Composite
50.6
163.4
Median Composite
50.3
164.5
Model II Regression Mosaic
51.8
159.7
Zone 48
Max NDVI Composite
80.6
321.9
Median Composite
85.9
234.3
Model II Regression Mosaic
84.1
264.4
Zone 54
Max NDVI Composite
81.5
232.7
Median Composite
85.2
186.2
Model II Regression Mosaic
81.0
239.4
Zone 59
Max NDVI Composite
76.6
338.0
Median Composite
80.9
275.4
Model II Regression Mosaic
79.0
302.7
T
able
7. R
esults
of
the
W
ilcoxon
S
igned
R
ank
P
aired
T
ests
C
onducted
on
the
R
andom
F
orest
O
ut
-
of
-B
ag
P
ercent
T
ree
-C
anopy
C
over
P
redictions
that were
D
erived
U
sing
the
D
ifferent
I
mage
T
ypes
. T
he
A
nalysis was
D
one
on
the
M
ulti
-
R
esolution
L
and
C
haracteristic
M
apping
Z
ones
16, 23, 48, 54,
and
59
Image Type 1
Image Type 2
p-value
Zone 16
Max NDVI Composite
Median Composite
0.90
Max NDVI Composite Model II Regression Mosaic
0.93
Median Composite
Model II Regression Mosaic
0.96
Zone 23
Max NDVI Composite
Median Composite
0.14
Max NDVI Composite Model II Regression Mosaic
0.04
Median Composite
Model II Regression Mosaic
0.02
Zone 48
Max NDVI Composite
Median Composite
0.73
Max NDVI Composite Model II Regression Mosaic
0.11
Median Composite
Model II Regression Mosaic
0.10
Zone 54
Max NDVI Composite
Median Composite
3.E-03
Max NDVI Composite Model II Regression Mosaic
0.54
Median Composite
Model II Regression Mosaic
0.24
Zone 59
Max NDVI Composite
Median Composite
0.11
Max NDVI Composite Model II Regression Mosaic
0.06
Median Composite
Model II Regression Mosaic
0.46
T
able
8. P
ercentage
of
A
ll
P
ercent
C
anopy
-C
over
V
alues
in
a
R
eference
I
mage
(L
eft
C
olumn
)
that
F
all
O
utside
the
95 P
ercent
C
onfidence
L
imits
as
P
redicted
by
the
C
omparative
I
mage
(T
op
R
ow
.) T
he
S
maller
the
N
umber
,
the
F
ewer
S
ignificant
D
ifferences
between
the
I
mage
T
ypes
. T
his
A
nalysis was
D
one
on
the
M
ulti
-R
esolution
L
and
C
haracteristic
M
apping
Z
ones
16, 23, 48, 54,
and
59
Zone 16
Zone 23
Comparative Images
Comparative Images
Reference Images Max NDVI
Median
Model II
Reference Images Max NDVI
Median
Model II
Max NDVI
0.04%
0.20% Max NDVI
0.04%
1.80%
Median
0.02%
0.08%
Median
0.00%
1.39%
Model II
0.15%
0.04%
Model II
0.03%
0.03%
Zone 48
Zone 54
Comparative Images
Comparative Images
Reference Images Max NDVI
Median
Model II
Reference Images Max NDVI
Median
Model II
Max NDVI
10.80% 9.24% Max NDVI
3.64%
3.19%
Median
1.09%
2.95%
Median
0.01%
1.66%
Model II
2.44%
5.89%
Model II
2.72%
3.85%
Zone 59
Comparative Images
Reference Images Max NDVI
Median
Model II
Max NDVI
7.28%
5.22%
Median
0.76%
2.76%
Model II
1.80%
5.73%
208
March 2016
PHOTOGRAMMETRIC ENGINEERING & REMOTE SENSING


