threshold should be tuned in the proposed
SLIM
. The num-
ber of matched-lines as well as the validity and capacity-
factors are directly impressed by this threshold. Although,
this threshold is not sensitive to the mild changes.
Based on the above results, some factors influence the
selection of proper threshold of
T
3
as the key threshold in
the proposed
SLIM
. These factors can be categorized as the
nominal attainable accuracy of the image, the accuracy of
the extracted line-segments, the attainable accuracy of the
proposed transformation model (i.e., in this paper, a 2D affine
transformation model), the size and topography of the area,
and the distribution of the extracted line-segments (it means
repetitive patterns or not).
To have a reliable balance between the threshold value
in addition to the number of matched-lines and validity
and capacity-factors, it is better to select the threshold
of
T
3
in the range of [5*
NA
, 7*
NA
]. In this investigation,
the selected value of
T
3
is denoted in Table 7.
• Finally, by fixing the above discussed thresholds (Table
7), the number of proper iterations (
R
) is also tested
over different relations (Table 5).
The results based on introducing different relations
(Table 5) over the first to third datasets are demon-
strated in Table 6. Since, in third dataset, maximum
possible input-triangles from
HQPS
-phase (i.e. number
of iterations) is 59,
R
4
is set equal to this number.
As shown in Table 6, the number of iterations (
R
2
to
R
4
)
does not affect the number of matched-lines by no means.
This is due to this fact that, only high-quality-patterns are
selected in
HQPS
-phase. So, only a limited number of them are
suitable to reach a reliable accurate results. After evaluating
the above results, the proposed relation is listed in Table 7.
The selected thresholds for the novel
SLIM
based on the
above experimental results are represented in Table 7.
The experimental results show that the proposed
SLIM
is
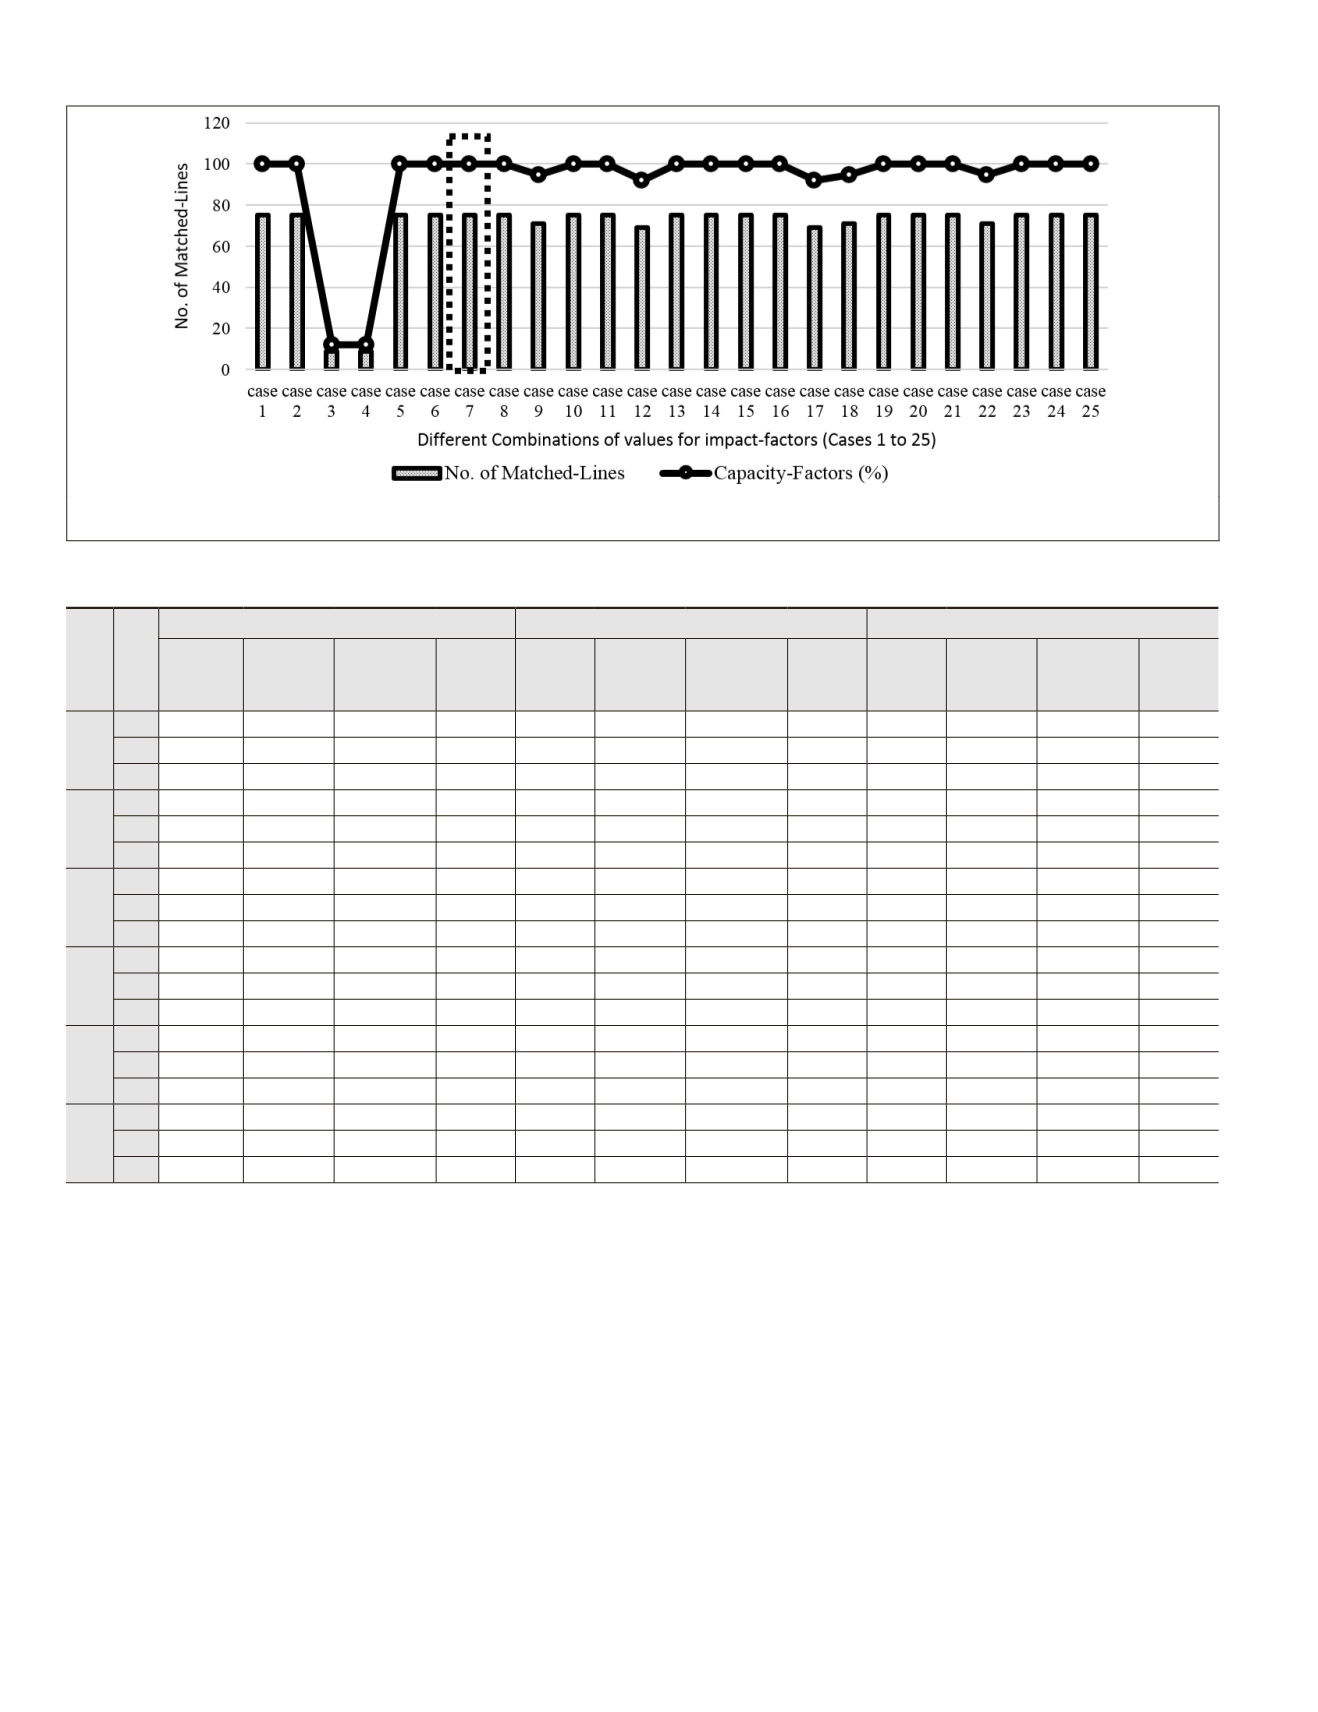
Figure 7. The influence of different combinations (case 1 to 25) of impact-factors (horizontal axis) on the number of matched-lines (clus-
tered columns) as well as capacity-factors (lines with markers) over the first dataset.
T
able
3. T
he
I
nfluence
of
D
ifferent
V
alues
of
and
on
the
N
umber
of
M
atch
-L
ines
, C
omputational
T
ime
,
as well
as
V
alidity
and
C
apacity
-F
actors
O
ver
the
F
irst
to
T
hird
datasets
T
1
T
2
1
st
Dataset
2
nd
Dataset
3
rd
Dataset
No. of
Match
Lines
Validity
Factor
(%)
Capacity
Factor (%)
Comp.
Time
(m.)
No. of
Match
Lines
Validity
Factor
(%)
Capacity
Factor (%)
Comp.
Time
(m.)
No. of
Match
Lines
Validity
Factor
(%)
Capacity
Factor (%)
Comp.
Time
(m.)
1°
0.1 63
100
84
0.50
57
100
93.4
0.25
26
100
83.9
2.69
0.3 63
100
84
0.57
57
100
93.4
0.10
26
100
83.9
3.07
0.5 63
100
84
0.58
57
100
93.4
0.10
26
100
83.9
2.82
2°
0.1 75
100
100
0.76
61
100
100
0.14
26
100
83.9
3.12
0.3 72
100
96
0.97
61
100
100
0.19
26
100
83.9
4.23
0.5 72
100
96
0.76
61
100
100
0.19
26
100
83.9
4.28
3°
0.1 75
100
100
1.12
61
100
100
0.23
26
100
83.9
3.33
0.3 72
100
96
1.33
61
100
100
0.35
26
100
83.9
4.37
0.5 72
100
96
1.09
61
100
100
0.36
26
100
83.9
4.62
4°
0.1 73
100
97.3
1.66
61
100
100
0.42
26
100
83.9
3.46
0.3 73
100
97.3
1.54
61
100
100
0.45
26
100
83.9
4.58
0.5 73
100
97.3
1.56
61
100
100
0.43
26
100
83.9
4.80
5°
0.1 74
100
98.7
2.18
61
100
100
0.47
26
100
83.9
3.58
0.3 74
100
98.7
2.13
61
100
100
0.45
26
100
83.9
4.64
0.5 74
100
98.7
2.17
61
100
100
0.40
26
100
83.9
4.91
10°
0.1 74
100
98.7
2.78
61
100
100
0.46
26
100
83.9
3.76
0.3 74
100
98.7
7.31
61
100
100
1.05
26
100
83.9
4.89
0.5 74
100
98.7
7.32
61
100
100
1.24
26
100
83.9
5.22
372
May 2016
PHOTOGRAMMETRIC ENGINEERING & REMOTE SENSING


