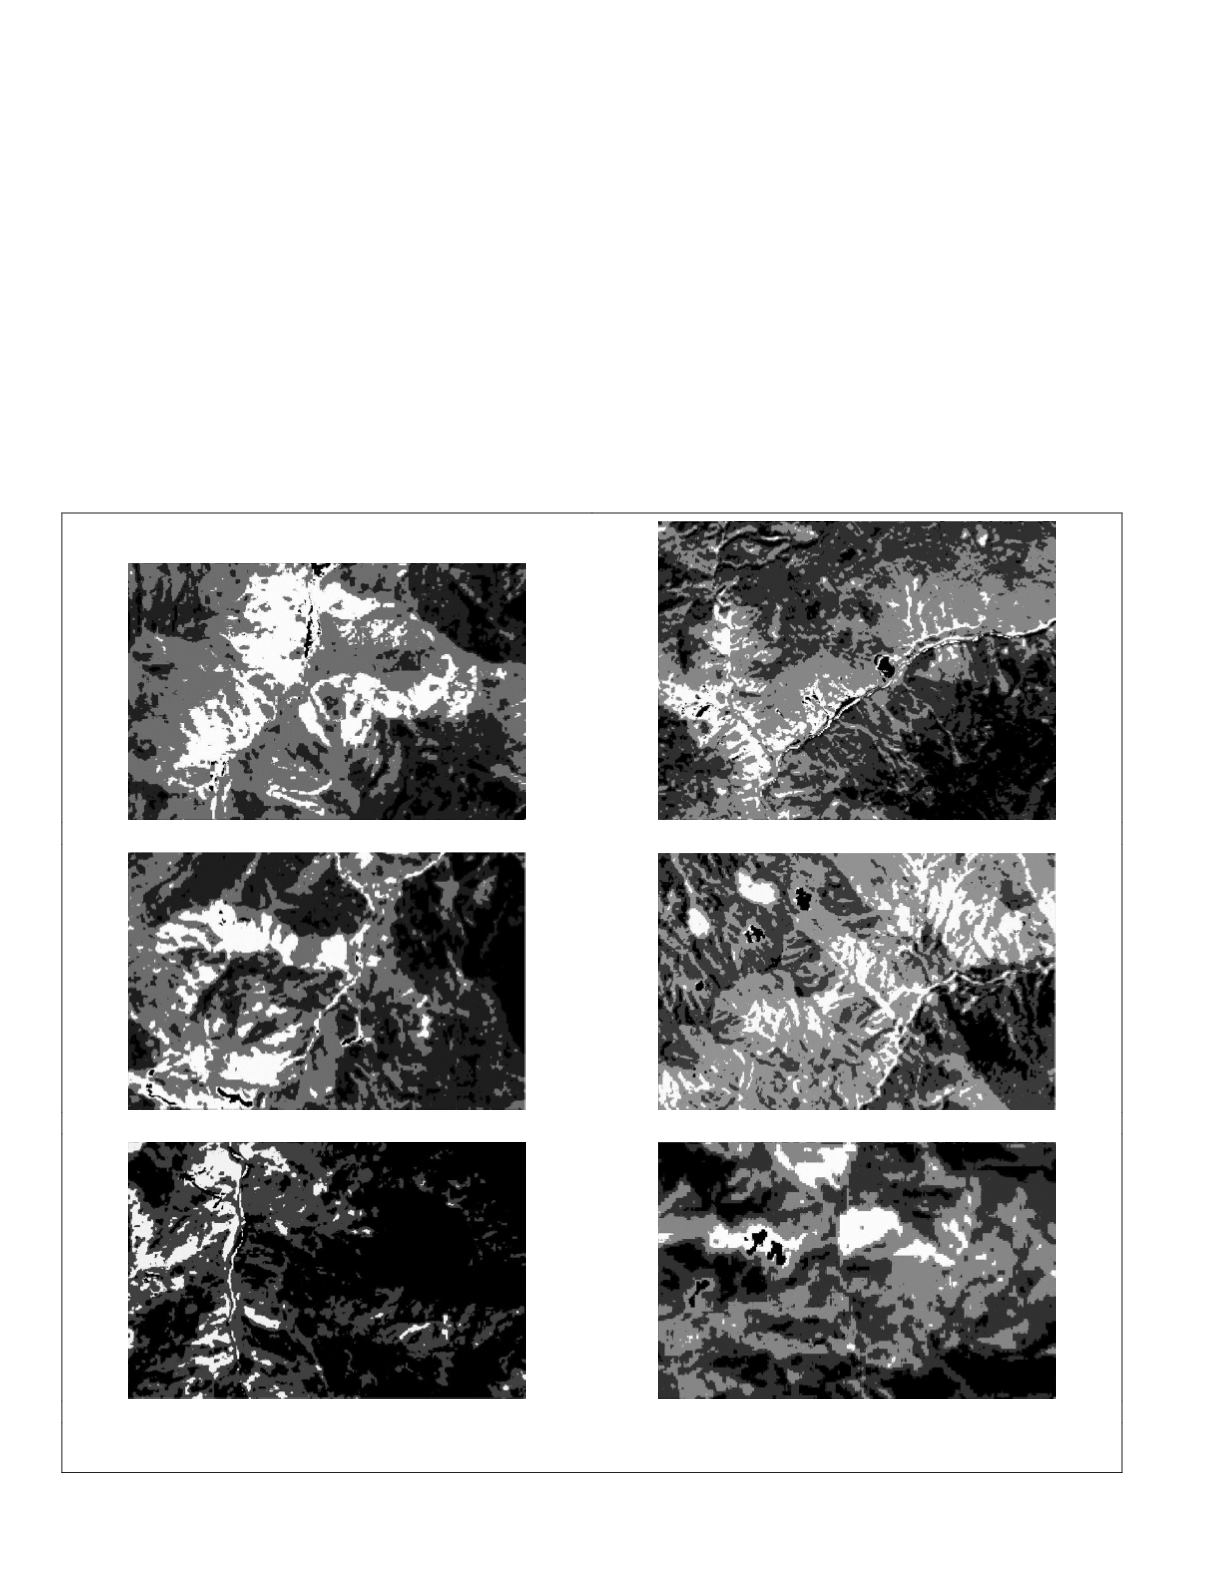
changes than the background. Therefore, calculating saliency
probability can enhance the changes and landslide regions
can be further highlighted.
According to the landslide saliency maps, we extracted
the landslides according to an proven value 200. The thresh-
old 200 is selected by trial and error, and fixed for landslide
detection from the ten study regions shown in Figure 7. If any
pixels in the maps have gray values larger than 200, the pixels
are still kept, or they will be reset to zero. The landslide de-
tection results are shown in Figure 8, corresponding with the
ground truth landslide maps. For the first six study regions in
research area One, the ground truth landslides are outlined
by manual visualization concerning the landslide mapping
proposed from (Bot, 2015). For the other four study regions
in research area Two, the ground truth landslides are drawn
from visual interpretation. Furthermore, the semi-automatic
landslide mapping method proposed in (Li
et al
., 2016) has
been implemented on our data as a comparison in terms of
accuracy. All the parameter settings follow the suggestions in
paper (Li
et al
., 2016), and the landslide detection results are
demonstrated in Figure 8 as well.
Obviously, the landslide detection results by our method
are more proximate to the ground truth landslides in Figure
8, while the semi-automatic method is not that effective as
described in paper (Li
et al
., 2016). The proposed method is
able to detect most landslides as shown in Figure 8a1 through
8n1 except for several false alarms in Figure 8c1, 8e1, 8i1,
8j1, and 8m1. The false alarms are the result of the complex
background, such as rock and road. They not only share
similar characteristics with landslides, but also have a strong
different color, and spatial and textural characteristics from
the background vegetation. Since saliency enhances regions
with large characteristic differences from the neighborhood
regions, several bare rocks are enhanced as well. The false
alarms are obvious especially for the cases in research area
Two (see Figure 8i1 through 8n1), which is a highly urbanized
area with numerous bare rocks. However, a small amount of
(a)
(b)
(c)
(d)
(e)
(f)
Figure 7. Saliency probability maps of landslides: (a) through (n) represent the saliency probability maps of research region of
A, B, C, D, E, F, I, J, M, and N in Figure 1 and Figure 2.
Continued on next page.
358
May 2017
PHOTOGRAMMETRIC ENGINEERING & REMOTE SENSING


