Soil Subclasses
Overall, soil classes show moderate intra-class and low inter-
class confusion. Especially, bare soil (such as a playground)
creates intra-class confusion and inter-class confusion with
the impervious class such as concrete. Addition of the bare
soil class lowered User’s accuracy of the plain area for
IAR
and
FAR
by 13 percent and 4 percent, respectively, and lowered
Producer’s accuracy by ~3 percent for
FAR
(Experiments 6 and
7; Tables 4 and 5). Intra-class confusion might occur because
of the heterogeneous cover in the plain test region which
might have some sub-areas with less vegetation cover resem-
bling bare soil. This confusion is less harmless and can be
avoided by choosing a test region with a more uniform cover
appropriately.
While residential class accuracy was unaffected in pres-
ence of bare soil reference signatures, in the presence of stone
quarry signature, bright regions in the residential zones were
mistaken for stone quarry. Hence, Producer’s accuracy was
decreased with respect to User’s accuracy for residential class
by 55 percent to 54 percent for
IAR
and
FAR
, respectively (Ex-
periment 6; Tables 4 and 5). More detailed study is required
to analyze the dominant effect of gravel signature on concrete
signature. Irrespective of high Producer’s accuracy for stone
quarry area User’s accuracy of 65 percent and 63 percent is
achieved by
FAR
and
IAR
(Experiment 6; Tables 4 and 5).
Overall Performance of the Physics-Based Methods
Performance of physics-based methods (Equations 3, 4, and
5) is in agreement with image-based methods for broad
VIS
categories (Experiments 1, 2, and 3; Table 3) but is decreased
relatively if subclasses of
VIS
are considered (Experiment 4
onwards; Table 3). Especially, if soil subclasses are considered
both the physics methods’ overall accuracies are dropped by
~2 to 4 percent as compared to
IAR
and/or
FAR
. Among the
physics-based methods,
EO-1
equation (Equation 3) produced
better results than
6S
. The overall drop in the accuracy could
be attributed to the drop in Producer’s accuracies for most
of the sub-classes (indicating increased omission errors) as
compared with
IAR
and
FAR
. Overall, physics-based methods
provide no substantial advantages over image based calibra-
tion methods. The accuracies of individual subclass experi-
ments such as impervious surfaces, soil and so on are consis-
tent with the image-based methods.
Optimal Flat Field Assessment
We assessed the suitability of various flat fields for discrimi-
nating urban land use land cover and further compared per-
formance of various flat fields with physics-based methods.
Flat Fields Comparison
Of all the flat fields,
PLCI
and
PLCT
provide marginal improve-
ment in average overall accuracies over
IAR
. Industrial roofs
also provide better average accuracy than
IAR
, that is, increase
by a percent is observed for both these surfaces. Broad level
VIS
classification (Experiments 1 and 2) does not have any
favorites, and all the flat fields provide very high accuracy
and are the same as
IAR
. The picture changes slightly for
subclasses of impervious surfaces and soil. When impervious
subclasses are considered,
PLCI
provide slightly better accura-
cy. Parking lot concrete (
CONP
) also matches these results.
IRTA
(Industrial roof) provides the best accuracies for soil subclass
experiments (Experiments 6 and 7) and vegetation subclass
experiments. Furthermore,
IRTA
shows marginal improve-
ment (1 to 2 percent) in accuracy over
IAR
. Interestingly, Plain
regions are slightly better flat fields than playground.
Best Flat Fields versus IAR, 6S, EO-1 Equation
Industrial roof provides best accuracies among all the flat
fields which may be due to its high radiance throughout the
wavelength range. There is average jump of ~3 percent in Us-
er’s accuracies as compared with
IAR
. Accuracies are improved
for soil classes for all the experiments: especially, experiments
wherein soil sub-classes are considered. Accuracies of most of
the other classes and subclasses of vegetation and impervious
surfaces remain unchanged (Tables 4 to 7). Producer’s accura-
cies also show average jump of ~1. The average increase in
User’s accuracy and Producer’s accuracy of
FAR
with respect to
6S
is ~8 percent and 5 percent and with respect to
EO-1
equa-
tion (Equation 3) is ~4 percent and ~2 percent, respectively.
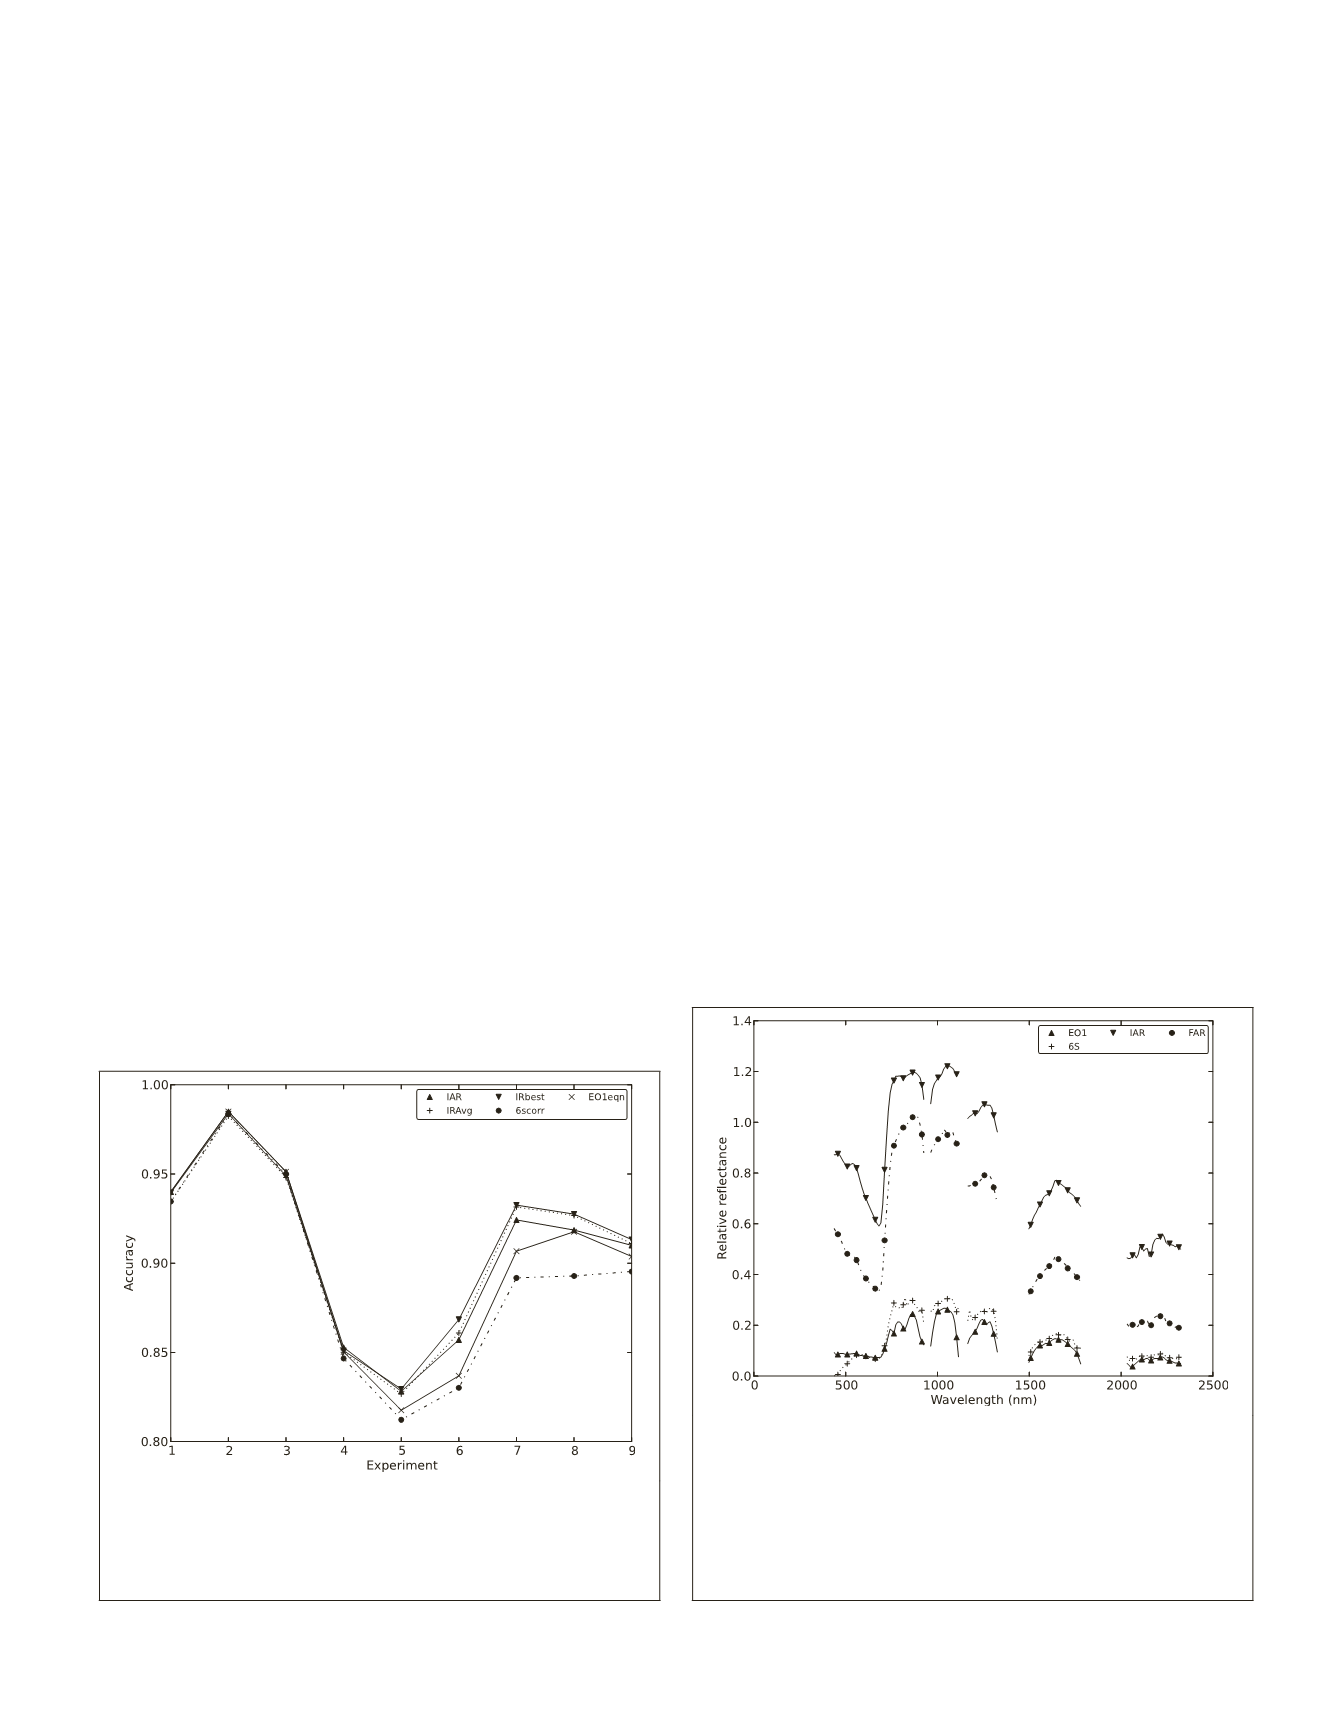
Overall, industrial roof covers provide near ideal Flat
Fields in urban settings and provide marginal to substan-
tial improvements over all the other reflectance calibration
methods (Figure 5). Physics-based methods exhibit residual
absorption errors whereas
FAR
(and
IAR
) relative reflectance
signatures are without such errors (Figure 6).
Figure 6. Comparison of vegetation spectral signatures us-
ing different calibration methods. Vegetation signature is
one of the very well-studied spectral signatures and shape
of the spectrum as created by different methods indicates
the effectiveness of the calibration method. As can be seen,
physics-based method have produced artefacts in infrared
region whereas
IAR
and
FAR
method have produced spec-
trum comparable to laboratory spectrum.
Figure 5. Overall accuracies of classification for different
atmospheric correction methods (
IAR
–
IAR
method,
IRB
est
– Best flat field – Industrial roof,
EO
1eqn – Results by
EO
1
equation,
IRA
vg. – Average over all industrial roofs, 6Scorr –
6S/V correction method).
PHOTOGRAMMETRIC ENGINEERING & REMOTE SENSING
May 2017
373


