(a)
(b)
(c)
(d)
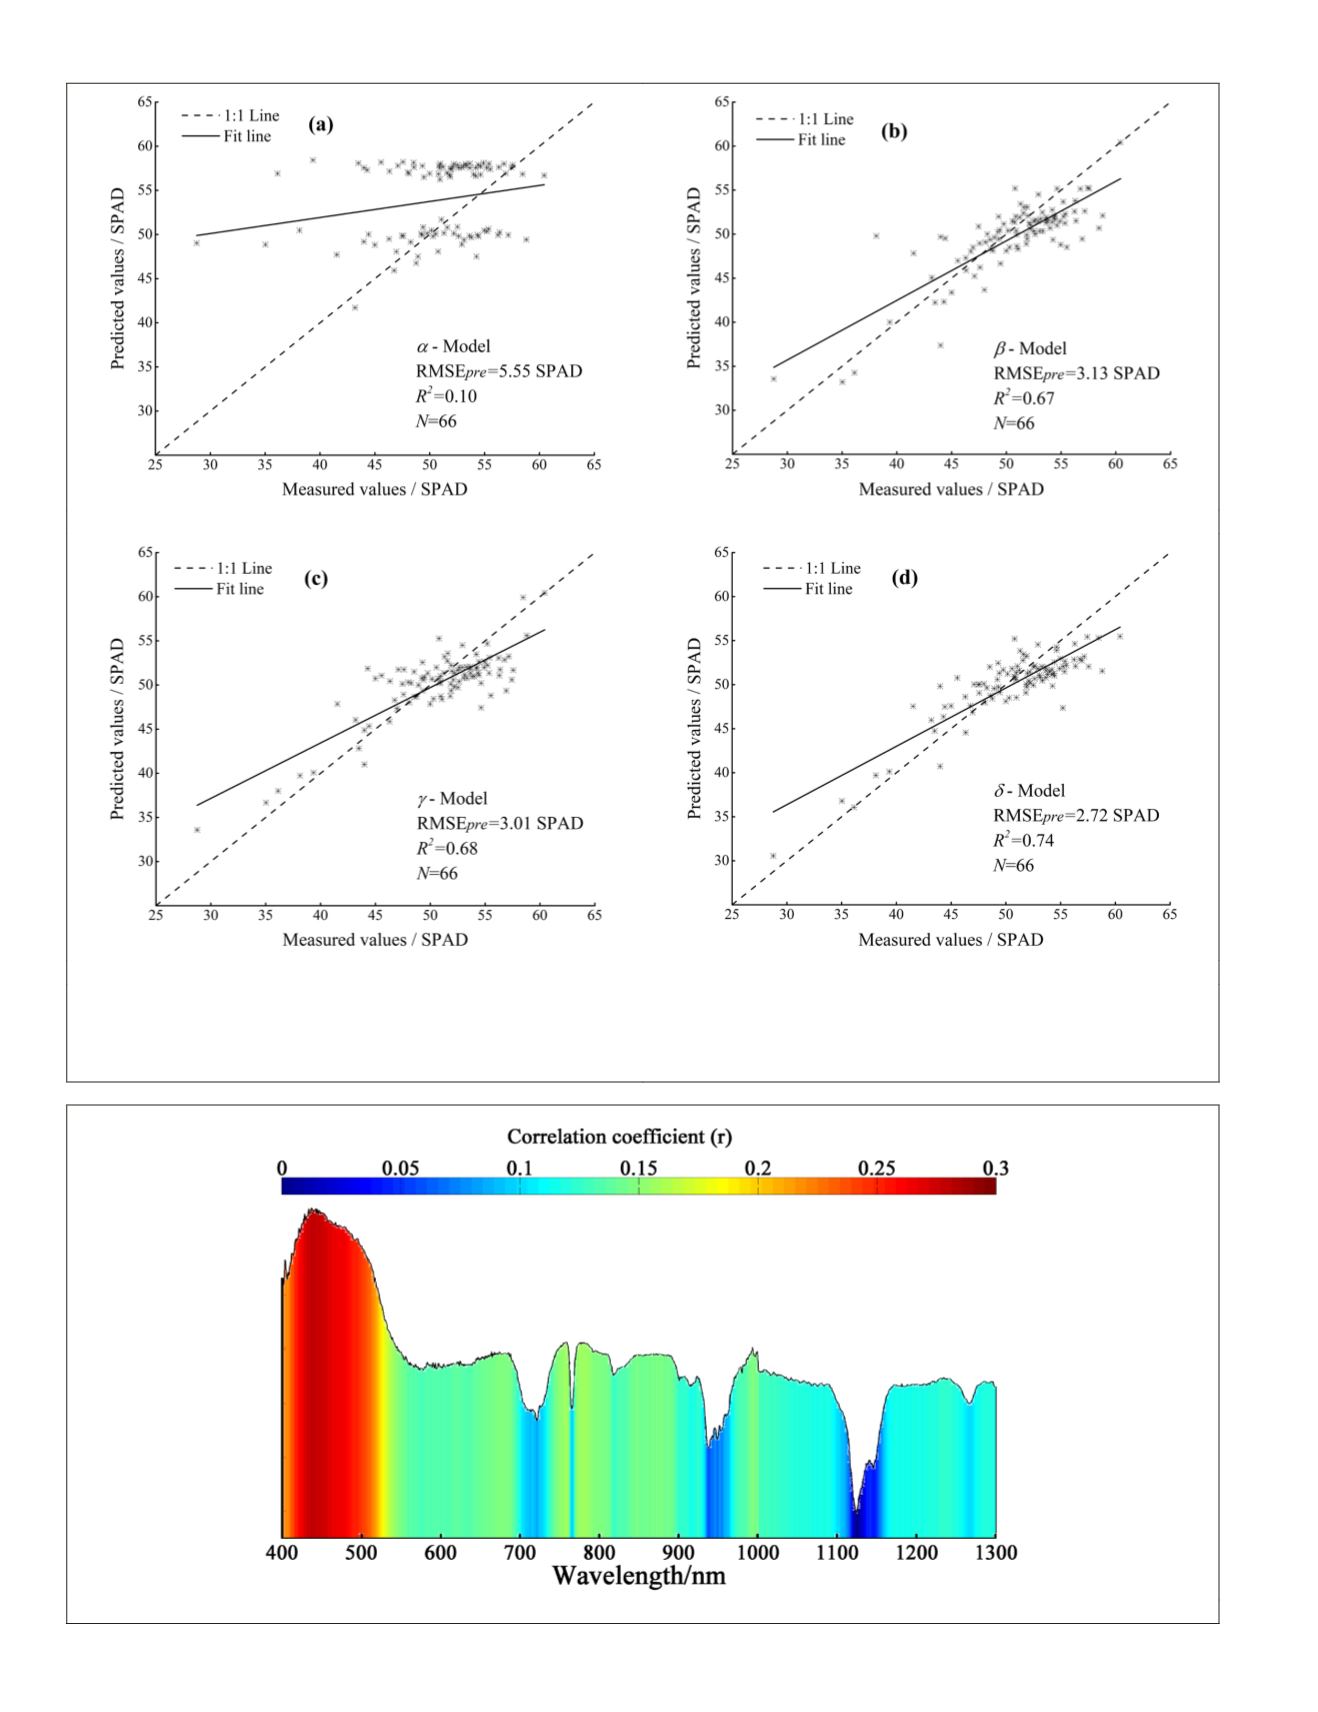
Figure 5. Scatter plots of predicted versus measured relative chlorophyll content using developed
PLSR
models: (a) Model
with variables (CRI1, CRI2, SIPS, GI, and SR); (b) Model with variables (
NDSI
(
R
849 nm
,
R
850 nm
),
NDSI
(
R
539 nm
,
R
553 nm
), and
NDSI
(
R
540 nm
,
R
553 nm
)); (c) Model with variables (
RSI
(
R
849 nm
,
R
850 nm
), RSI (
R
539 nm
,
R
553 nm
), and
RSI
(
R
540 nm
,
R
553 nm
)); and (d) Model with
variables (CI (
R
849 nm
,
R
850 nm
), CI (
R
539 nm
,
R
553 nm
), CI (
R
540 nm
,
R
553 nm
), and CI (
R
536 nm
,
R
553 nm
)).
Figure 6. Correlation between relative chlorophyll content and reflectance of wavelength 400-1300 nm.
808
December 2018
PHOTOGRAMMETRIC ENGINEERING & REMOTE SENSING


