et al
., 2007). In general, the
SPAD
value is directly used as a
relative value to characterize the leaf chlorophyll concentra-
tion. The measurement of relative leaf chlorophyll content
(
SPAD
) in wheat was synchronized with the measurement of
the spectrum. To facilitate the measurement, select the fully
expanded leaves and select the top leaf to the second leaf of
each leaf, and use the
SPAD
-502 chlorophyll meter for the tip
of each leaf. The two parts of the leaf base were measured five
times. The same leaf had ten
SPAD
values measured and aver-
aged as the relative chlorophyll content of the whole leaf.
To establish the
PLSR
models, relative chlorophyll content
was classified using SPSS
®
(version 19.0). Subsequently, the
data were divided into two subsets by uniformed space. One
subset was used for training (
n
= 99), and the other subset
was used for testing purposes (
n
= 66). The main descriptive
statistics of relative chlorophyll content data are provided in
Table 1. The average relative chlorophyll content values that
corresponded to the calibration set and validation set were
50.7
SPAD
and 50.0
SPAD
, respectively, and the coefficients of
variation were 9.3% and 10.6%, respectively. The average
value from all sampling plots in the study area was 50.4
SPAD
,
which was between the mean value both of calibration and
validation sets. The coefficient of variation (
CV
) was 9.7%,
which was a medium degree of variation (Nijat
et al
., 2017).
The value range was between the
CV
of the calibration set and
the
CV
of the validation set.
Table 1. Statistical characteristics of wheat relative
chlorophyll content in the sampling area (
SPAD
)
Type of sample Observations
Max
value
Min
value
Mean
value SD
C.V.
(%)
Calibration set
99
60.4 35.1 50.7 4.7 9.3
Validation set
66
59.8 28.7 50.0 5.3 10.6
Whole set
165
60.4 28.8 50.4 4.9 9.7
Note: Max is maximum, Min is minimum, SD is standard deviation,
C.V. is the coefficient of variation.
Hyperspectral Reflectance Measurements
Spectral reflectance data of spring wheat leaves were obtained
using an Analytical Spectral Devices Field Spec
®
3 portable
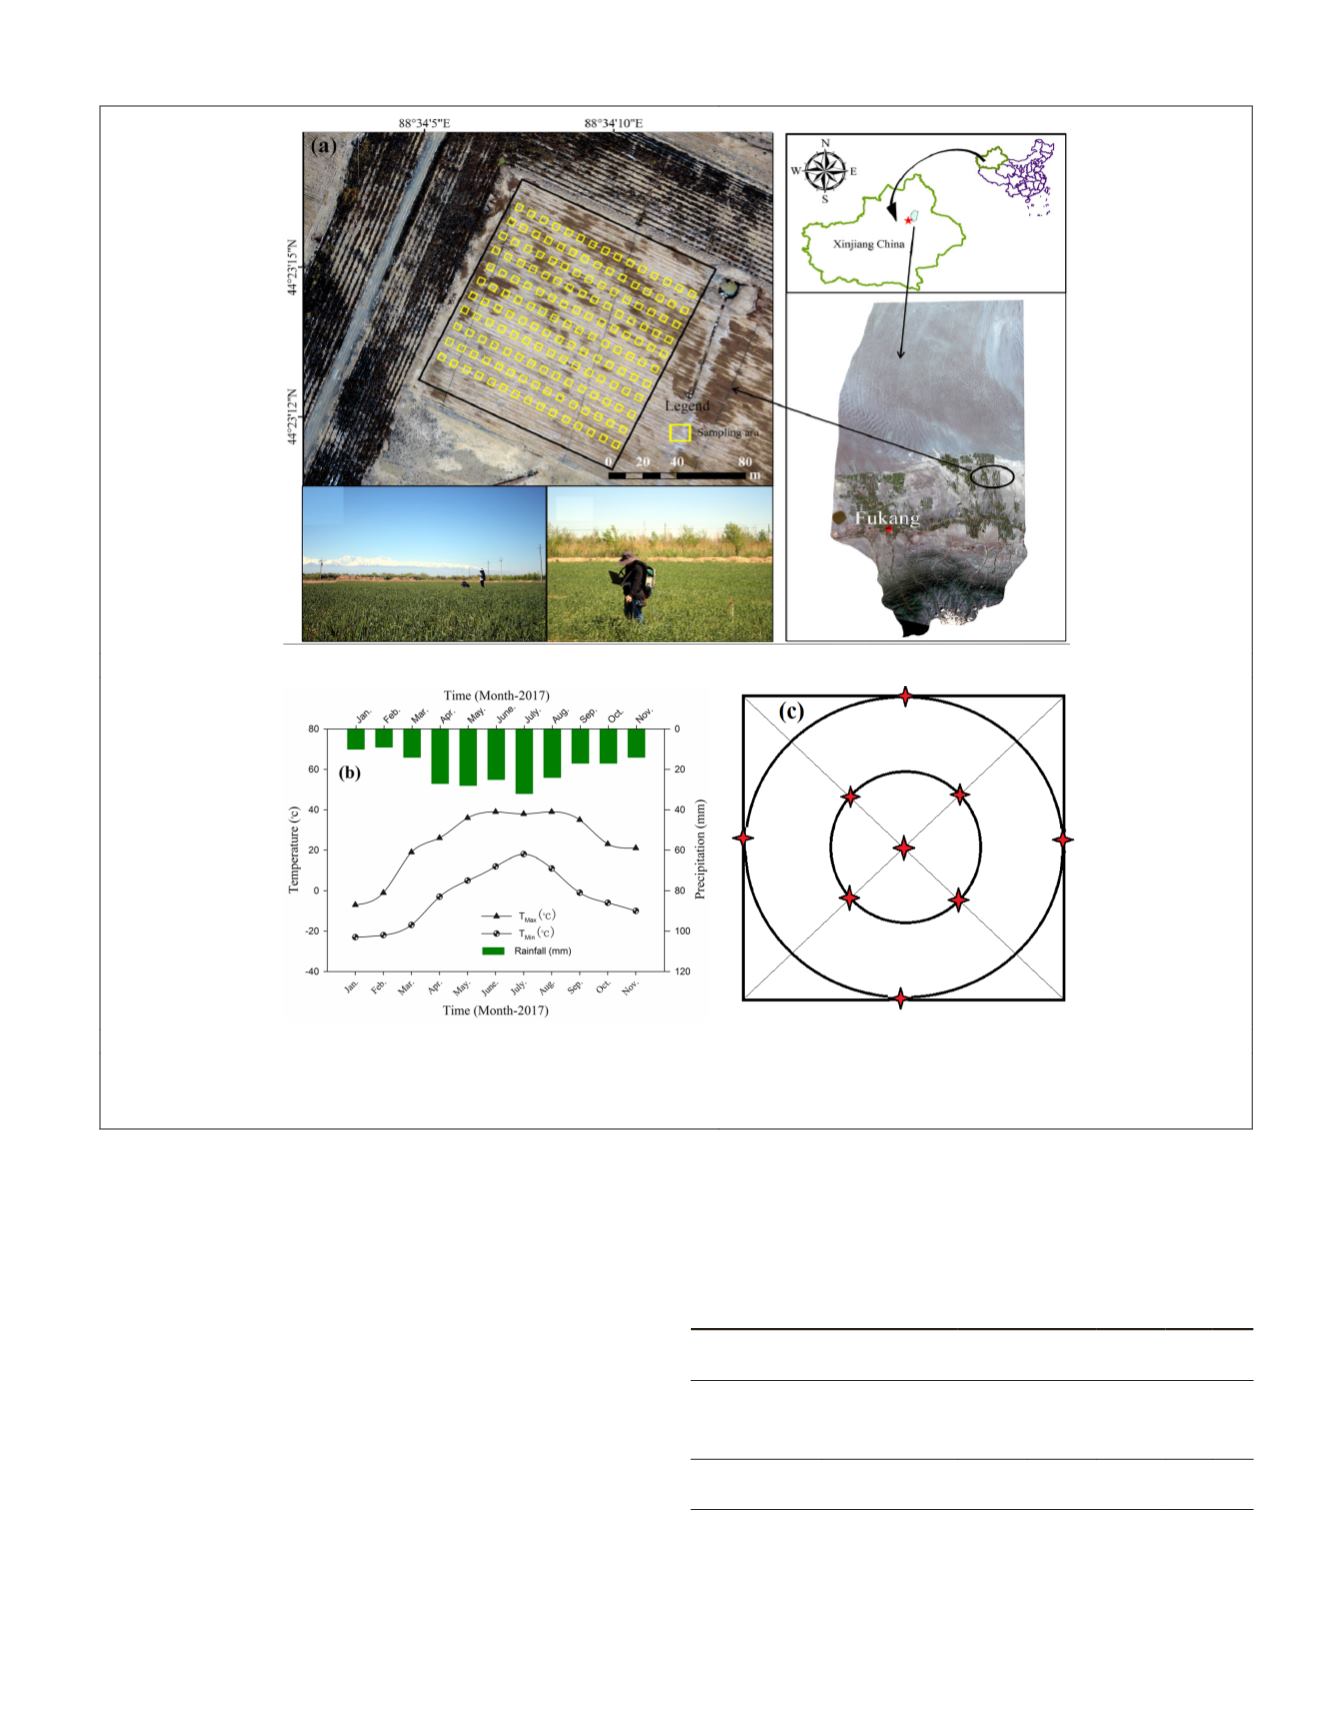
(a)
(b)
(c)
Figure 1. (a) Overview of the experiment base used for the sampling area in the present study (source: Unmanned Aerial
Vehicle
UAV
image). Field investigation and data collection; (b) Daily average minimum (T
min
, °C), maximum air temperature
(T
max
, °C) and amount of daily precipitation (mm) events; and (c) Sampling standard in each plot.
PHOTOGRAMMETRIC ENGINEERING & REMOTE SENSING
December 2018
803


