that were conducted for relative chlorophyll content in spring
wheat. Correlation between leaf reflectance spectra and rela-
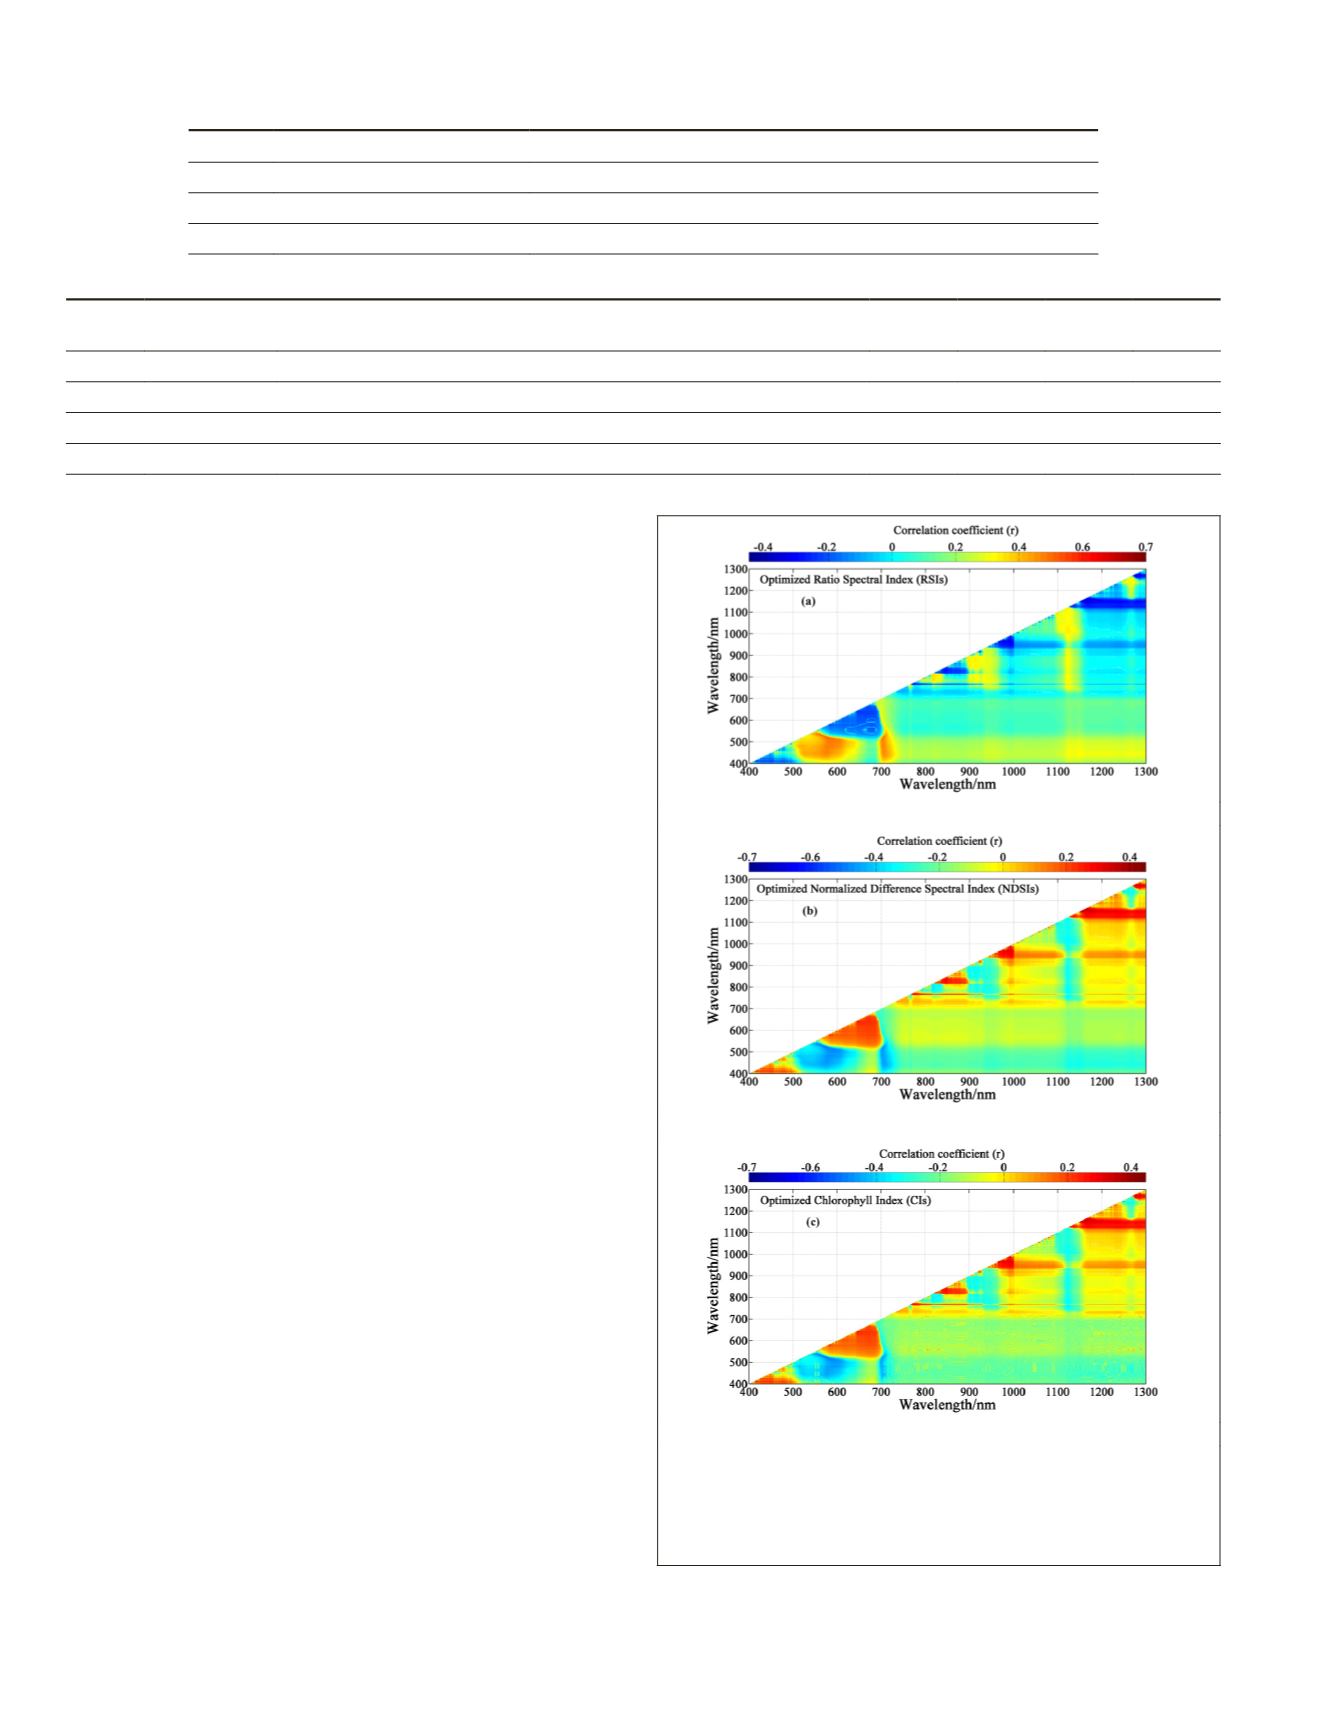
tive chlorophyll content is presented.
NDSI
(
R
849 nm
,
R
850nm
),
RSI
(
R
849 nm
,
R
850 nm
), and
CI
(
R
849 nm
,
R
850 nm
) were the most highly
correlated optimized indices with relative chlorophyll con-
tent (), which is in the NIR band (780~1100 nm). Optimized
indices (
NDSIs
,
RSIs
and
CIs
) between the yellow (570~630 nm)
and green regions (530~580 nm) resulted in significant high
correlations (0.4
≤
|
r
|
≤
0.6) (Table 4).
PLSR
Model Analysis and Evaluation
In this paper, the
PLSR
model with predictive variables
was selected based on the rule (
VIP
) that the addition of other
variables should increase the accuracy of the model (Jin
et al
.,
2009; Cho,
et al
., 2007). The influence of each spectral index
in the
PLSR
model is illustrated in Figure 4 with correspond-
ing
VIP
values. The
VIP
method revealed the importance of the
previously published spectral indices and optimized indices
for relative chlorophyll content. The indices (CRI1, CRI2,
SIPS, G-M, and SR) revealed more influence and maximum
VIP
values (value
≥
1) in previously published spectral indi-
ces. The local maximum
VIP
values (value
≥
1) were 536 nm,
553 nm, 539 nm, 510 nm, 540 nm, 849 nm, and 850 nm in
optimized spectral indices, whereas 849 and 850 nm exhib-
ited the highest
VIP
values (value
≥
1.2). The best predictive
variables for the
PLSR
model were selected, and four models
(
α
,
β
,
γ
and
δ
) were developed to estimate relative chlorophyll
content in spring wheat. Selected variables and details of
PLSR
model accuracy are described in Table 5. Scatter plots of the
predicted and measured relative chlorophyll content values
for the
PLSR
predictive models were established to illustrate
the predictive ability of the
PLSR
models in relative chlo-
rophyll content estimation using the
R
2
and
RMSE
Pre
for the
independent validation dataset (
n
= 66).
Predictive model results are presented in Table 5. Based
on the coefficient (
R
2
) and
RMSE
, the -model showed that the
highest coefficient (
R
2
Pre
=0.74) and lowest
RMSE
(
RMSE
Pre
=2.72
SPAD
) was identified with four optimized indices (
CI
(
R
849 nm
,
R
850 nm
),
CI
(
R
539 nm
,
R
553 nm
),
CI
(
R
540 nm
,
R
553 nm
), and
CI
(
R
536 nm
,
R
553
nm
)). The models
and
also exhibited good predictive ability,
with
R
2
Pre
values of 0.67 and 0.68, respectively, and
RMSE
Pre
values of 3.13 and 3.01
SPAD
in optimized indices (
NDSI
(
R
849
nm
,
R
850 nm
),
NDSI
(
R
539 nm
,
R
553 nm
),
NDSI
(
R
540nm
,
R
553 nm
),
RSI
(
R
849 nm
,
R
850 nm
),
RSI
(
R
539 nm
,
R
553 nm
), and
RSI
(
R
540nm
,
R
553 nm
)). The -model
had low
R
2
Pre
(0.10), high
RMSE
Pre
(5.55
SPAD
), and weak predic-
tive ability for estimating the relative chlorophyll content in
all the studies.
Scatter plots of the predicted and measured relative
chlorophyll content using predictive models are presented in
Figure 5. Overall, 16 previously published spectral indices
and three optimized spectral indices (
NDSIs
,
RSIs
, and
CIs
) were
(a)
(b)
(c)
Figure 3. Three-dimensional maps (contour diagrams)
demonstrating the correlation (
r
) between the relative
chlorophyll content and narrow-band
RSI
,
NDSI
, and
CI
calculated from all possible two-band combinations in the
range of 400-1300 nm.
Table 4. The highest values of correlation (
r
) between optimized indices and relative chlorophyll content.
Variables |
r
|
≤
0.7
0.6
≤
|
r
|
≤
0.7
NDSIs
(
R
849 nm
–
R
850 nm
)/(
R
849 nm
+
R
850 nm
) (
R
539 nm
–
R
553 nm
)/(
R
539 nm
+
R
553 nm
), (
R
540 nm
–
R
553 nm
)/(
R
540 nm
–
R
553 nm
)
RSIs
(
R
849 nm
/
R
850 nm
)
(
R
539 nm
/
R
553 nm
), (
R
540 nm
/
R
553 nm
)
CIs
(
R
-1
849 nm
–
R
-1
850 nm
)
R
850 nm
(
R
-1
539 nm
–
R
-1
553 nm
)
R
553 nm
, (
R
-1
540 nm
–
R
-1
553 nm
)
R
553 nm
, (
R
-1
536 nm
–
R
-1
553 nm
)
R
553 nm
Table 5. Models for prediction.
Models
Number of
VIP (VIP1.0)
Variables
R
2
Cal
RMSE
Cal
(SPAD)
R
2
Pre
RMSE
Pre
(SPAD)
α
5
CRI1, CRI2, SIPS, GI, SR
0.27
4.22
0.10
5.55
β
3
NDSI (
R
849nm
,
R
850nm
), NDSI (
R
539nm
,
R
553nm
), NDSI (
R
540nm
,
R
553nm
)
0.62
3.53
0.67
3.13
γ
3
RSI (
R
849nm
,
R
850nm
), RSI (
R
539nm
,
R
553nm
), RSI (
R
540nm
,
R
553nm
)
0.64
3.47
0.68
3.01
δ
4
CI (
R
849nm
,
R
850nm
), CI (
R
539nm
,
R
553nm
), CI (
R
540nm
,
R
553nm
), CI (
R
536nm
,
R
553nm
)
0.67
3.48
0.74
2.72
806
December 2018
PHOTOGRAMMETRIC ENGINEERING & REMOTE SENSING


