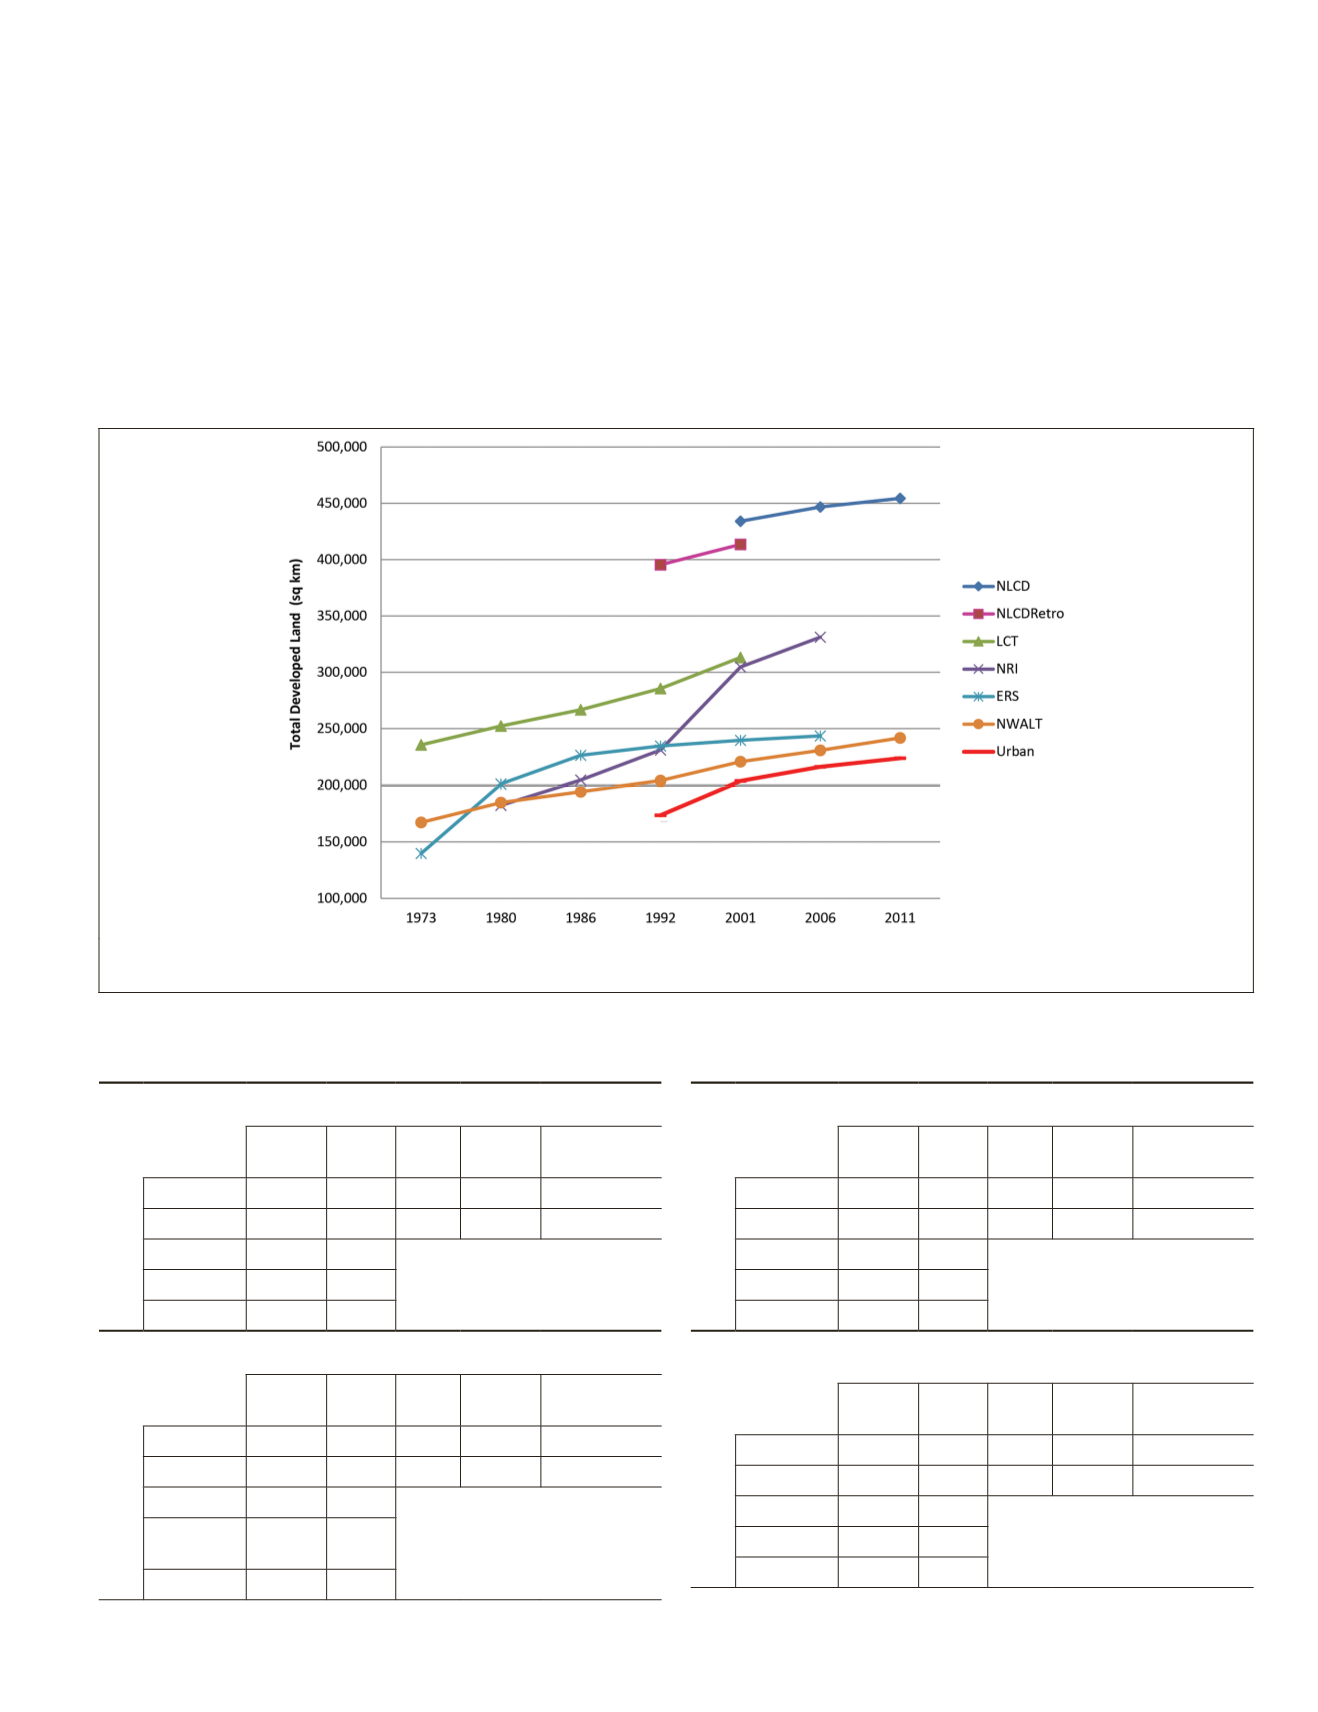
Service (
ERS
) data (US Department of Agriculture, 2011), and
NWALT
dataset (Falcone, 2015) (Figure 6). The accuracy as-
sessment results using the urban reference class information
demonstrate that
NLCD
includes substantial non-urban area in
its developed class across
CONUS
, as evidenced by high urban
commission errors in 2001 and 2006 (Table 3). By removing
approximately 230,000 km
2
of rural road area from the
NLCD
developed class for each of the three dates mapped, we cre-
ated urban maps with substantially smaller area of urban rela-
tive to the total area of the
NLCD
developed class. The urban
maps also had smaller area than other estimates provided by
map and survey data generated by
USGS
and
USDA
(Figure 6).
By excluding rural roads and small patches of rural
development from
NLCD
, we created urban maps that more
accurately portray the true core urban areas and consequently
serve to better monitor the rates of change and spatial patterns
of dense urban clusters.
The urban maps reduced urban commission errors by over
30 percent relative to
NLCD
while trading off only a 4 percent
increase in urban omission error. Furthermore, revising the
NLCD
maps led to substantially fewer roads in the urban maps.
Comparing
NLCD
and urban maps based on the reference sam-
ple data illustrates that the processing removed 92 percent
of rural roads in 2001 and 84 percent of rural roads in 2006.
Lower commission errors relative to
NLCD
provide evidence
that
NLCD
includes roads that should not be classified as urban
land use. On the other hand, higher urban omission errors
are the result of the multi-tiered clean-up processes, where
Figure 6. Area of developed land (km
2
) for
CONUS
across all readily accessible tabular data and spatially-explicit maps. The
Urban results represent the maps created by removing rural roads from the
NLCD
developed class.
Table 3. Confusion matrix for 2001 and 2006
NLCD
and urban maps. Values shown are percent area of the conterminous United
States. User’s and producer’s accuracies, as well as commission and omission error estimates, are reported as percents with
standard errors in parentheses.
2001 NLCD Developed Map
Reference
NLCD Developed Map
Not
Urban Urban Total
User Commission
Not Urban 93.93 0.48 94.42 99 (1)
1 (1)
Urban 3.32 2.27 5.58 41 (2)
59 (2)
Total
97.25 2.75
Producer 97 (1) 82 (5)
Omission 3 (1)
18 (5)
Overall 96.2% (0.2)
2001 Urban Map
Reference
Urban Map
Not
Urban Urban Total
User Commission
Not Urban 96.56 0.60 97.16 99 (1)
1 (1)
Urban 0.69 2.15 2.84 76 (2)
24 (2)
Total
97.25 2.75
Producer
Accuracy
99 (1) 78 (5)
Omission 1 (1)
22 (5)
Overall 98.7% (0.2)
2006 NLCD Developed Map
Reference
NLCD Developed Map
Not
Urban Urban Total
User Commission
Not Urban 93.80 0.46 94.26 99 (1)
1 (1)
Urban 3.30 2.44 5.74 43 (2)
57 (2)
Total
97.10 2.90
Producer 97 (1) 84 (5)
Omission 3 (1)
16 (5)
Overall 96.2% (0.2)
2006 Urban Map
Reference
Urban Map
Not
Urban Urban Total
User Commission
No Urban 96.42 0.59 97.01 99 (1)
1 (1)
Urban 0.68 2.31 2.99 77 (2)
23 (2)
Total
97.10 2.90
Producer 99 (1) 80 (5)
Omission 1 (1)
20 (5)
Overall 98.7% (0.2)
PHOTOGRAMMETRIC ENGINEERING & REMOTE SENSING
February 2018
107


